Set up your client project: funnel definitions and conversion targets
Teams build one Juma project per client and add context over time. Every flow the team runs for that client pulls from the same project. If a project already exists, adding funnel context means each analysis starts from the client's own definitions and targets instead of inferring them from the data.
What to add
Funnel Stage Definitions
Which events define each stage of the funnel, mapped to the analytics platform (GA4 event names, PostHog events, or custom events). When this exists, the analysis uses the client's actual funnel rather than inferring stages from the available data. Especially valuable when the funnel includes custom events that are not obvious from page views alone.
Conversion Targets and Benchmarks
Target conversion rates by stage, acceptable drop-off thresholds, and historical baselines. With this in the project, every analysis measures against the client's own goals instead of relying on industry averages.
Past Funnel Reports
Previous funnel analyses from earlier periods. When present, the analysis compares trends over time and tracks whether past recommendations moved the numbers. If analytics accounts are already connected, Juma can pull historical data directly, so this file becomes optional.
Guide Juma with project info
Add a short description to each knowledge item in the project's info field so Juma knows what each file contains and when to use it. For example:
- Funnel Stage Definitions: "Event-to-stage mapping for all analytics platforms. Read this before pulling funnel data."
- Conversion Targets and Benchmarks: "The client's own targets by stage. Measure against these, not industry averages."
- Past Funnel Reports: "Previous analyses for trend comparison. Check whether past recommendations moved the numbers."
See where your funnel is actually breaking
Frequently Asked Questions
What does a conversion funnel analysis cover?
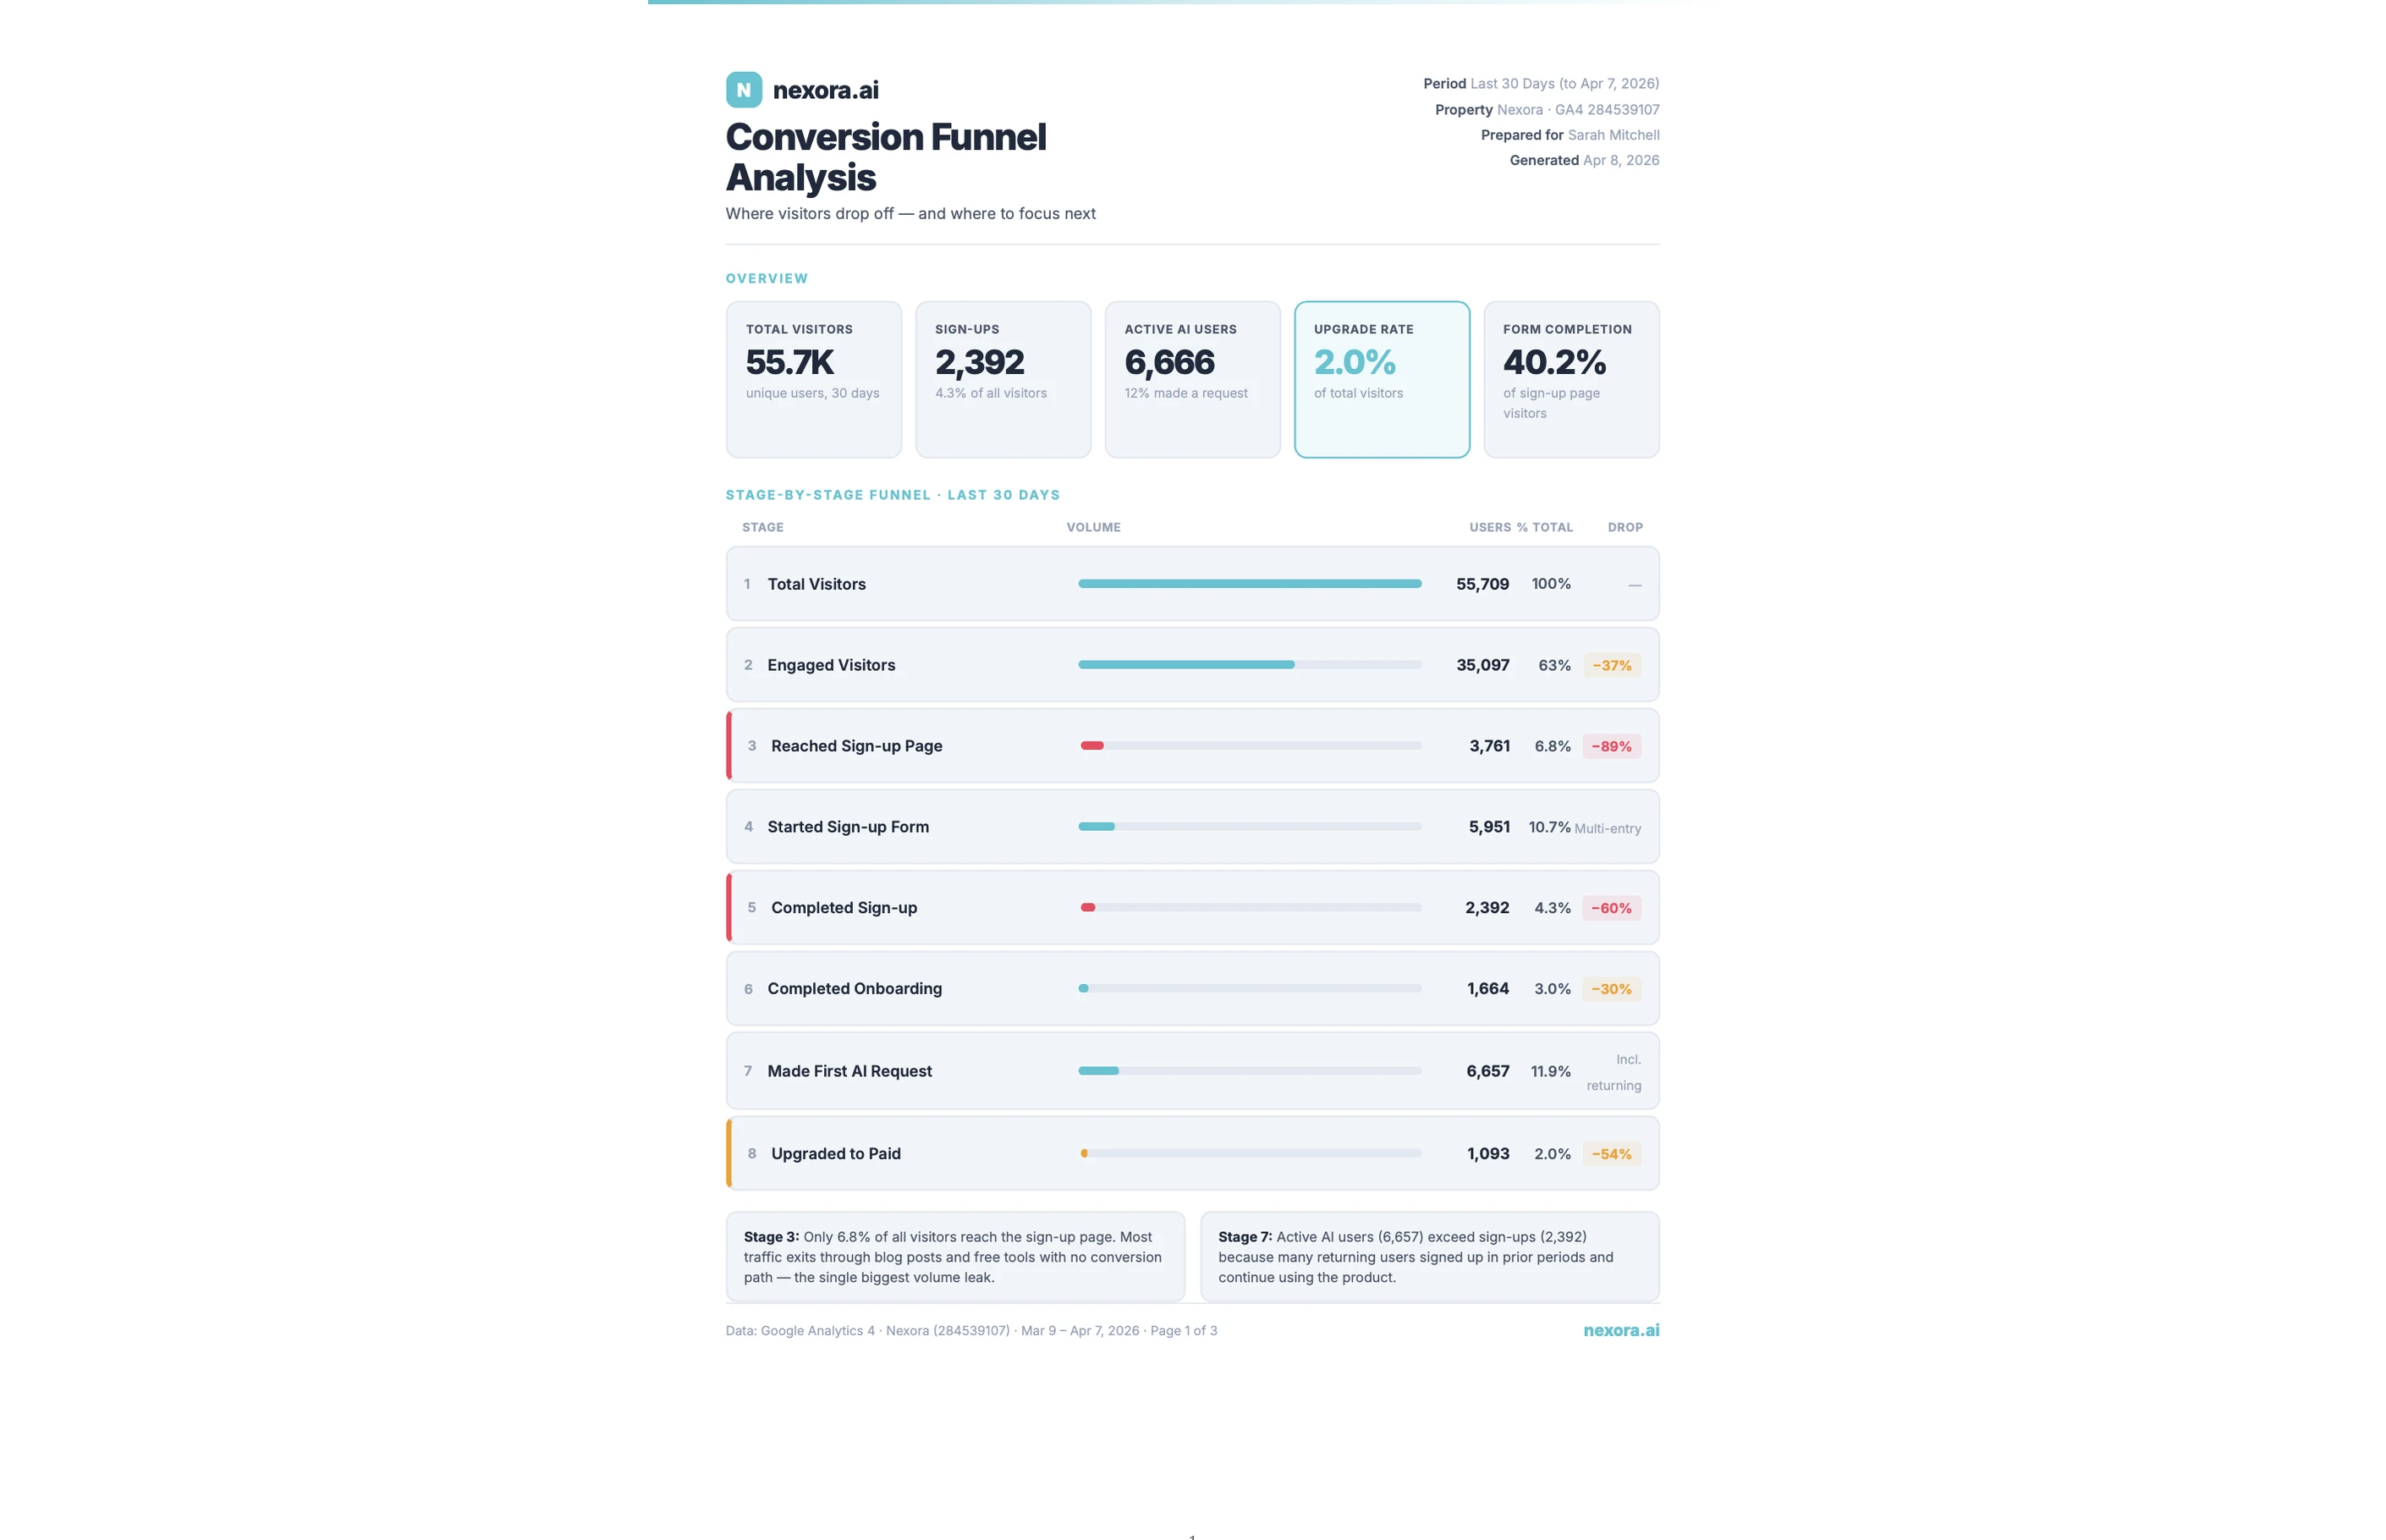
A conversion funnel analysis maps each stage of the funnel with real numbers: entries, exits, drop-off rates, and the gap between adjacent stages. Results are split by traffic source and device type to reveal which channel-device combinations convert and which ones pull the overall rate down.
The shape of the funnel becomes visible at a glance, so the conversation shifts from "conversions feel low" to "we lose 68% of visitors between the product page and checkout." Paid search visitors, organic blog traffic, and direct visitors often convert at very different rates, and the device breakdown surfaces whether mobile or desktop drives a specific drop-off. Without those splits, a blended average describes no user group accurately. When multiple analytics sources are connected, Juma cross-references event counts to flag tracking gaps before any optimization decisions are made.
What happens when no analytics account is connected?
If no analytics account is connected, upload a CSV export or share screenshots from your analytics platform and the Flow runs the analysis from that data. Most tools including GA4, PostHog, and Mixpanel support CSV exports of funnel reports. Either format provides enough data to map stages, calculate drop-off rates, and identify the largest gaps.
Live connections to Google Analytics, PostHog, or Google Ads return deeper results. With a live connection, the analysis pulls segment breakdowns automatically, cross-references event counts across platforms, and detects tracking gaps that would not appear in a static export. Manual uploads reflect data at a single point in time and require a fresh upload each time the analysis runs. For teams running the Flow monthly, connecting an analytics account removes that manual step and makes re-running the analysis as simple as starting a new session.
Does the analysis support website funnel analysis for multi-step product flows?
Yes. Whether the funnel covers a marketing path such as landing page to trial signup, or a product flow such as signup to first action completed, the analysis runs from the funnel definition the team provides. Specifying the start and end stages keeps results focused on the conversion path that matters most.
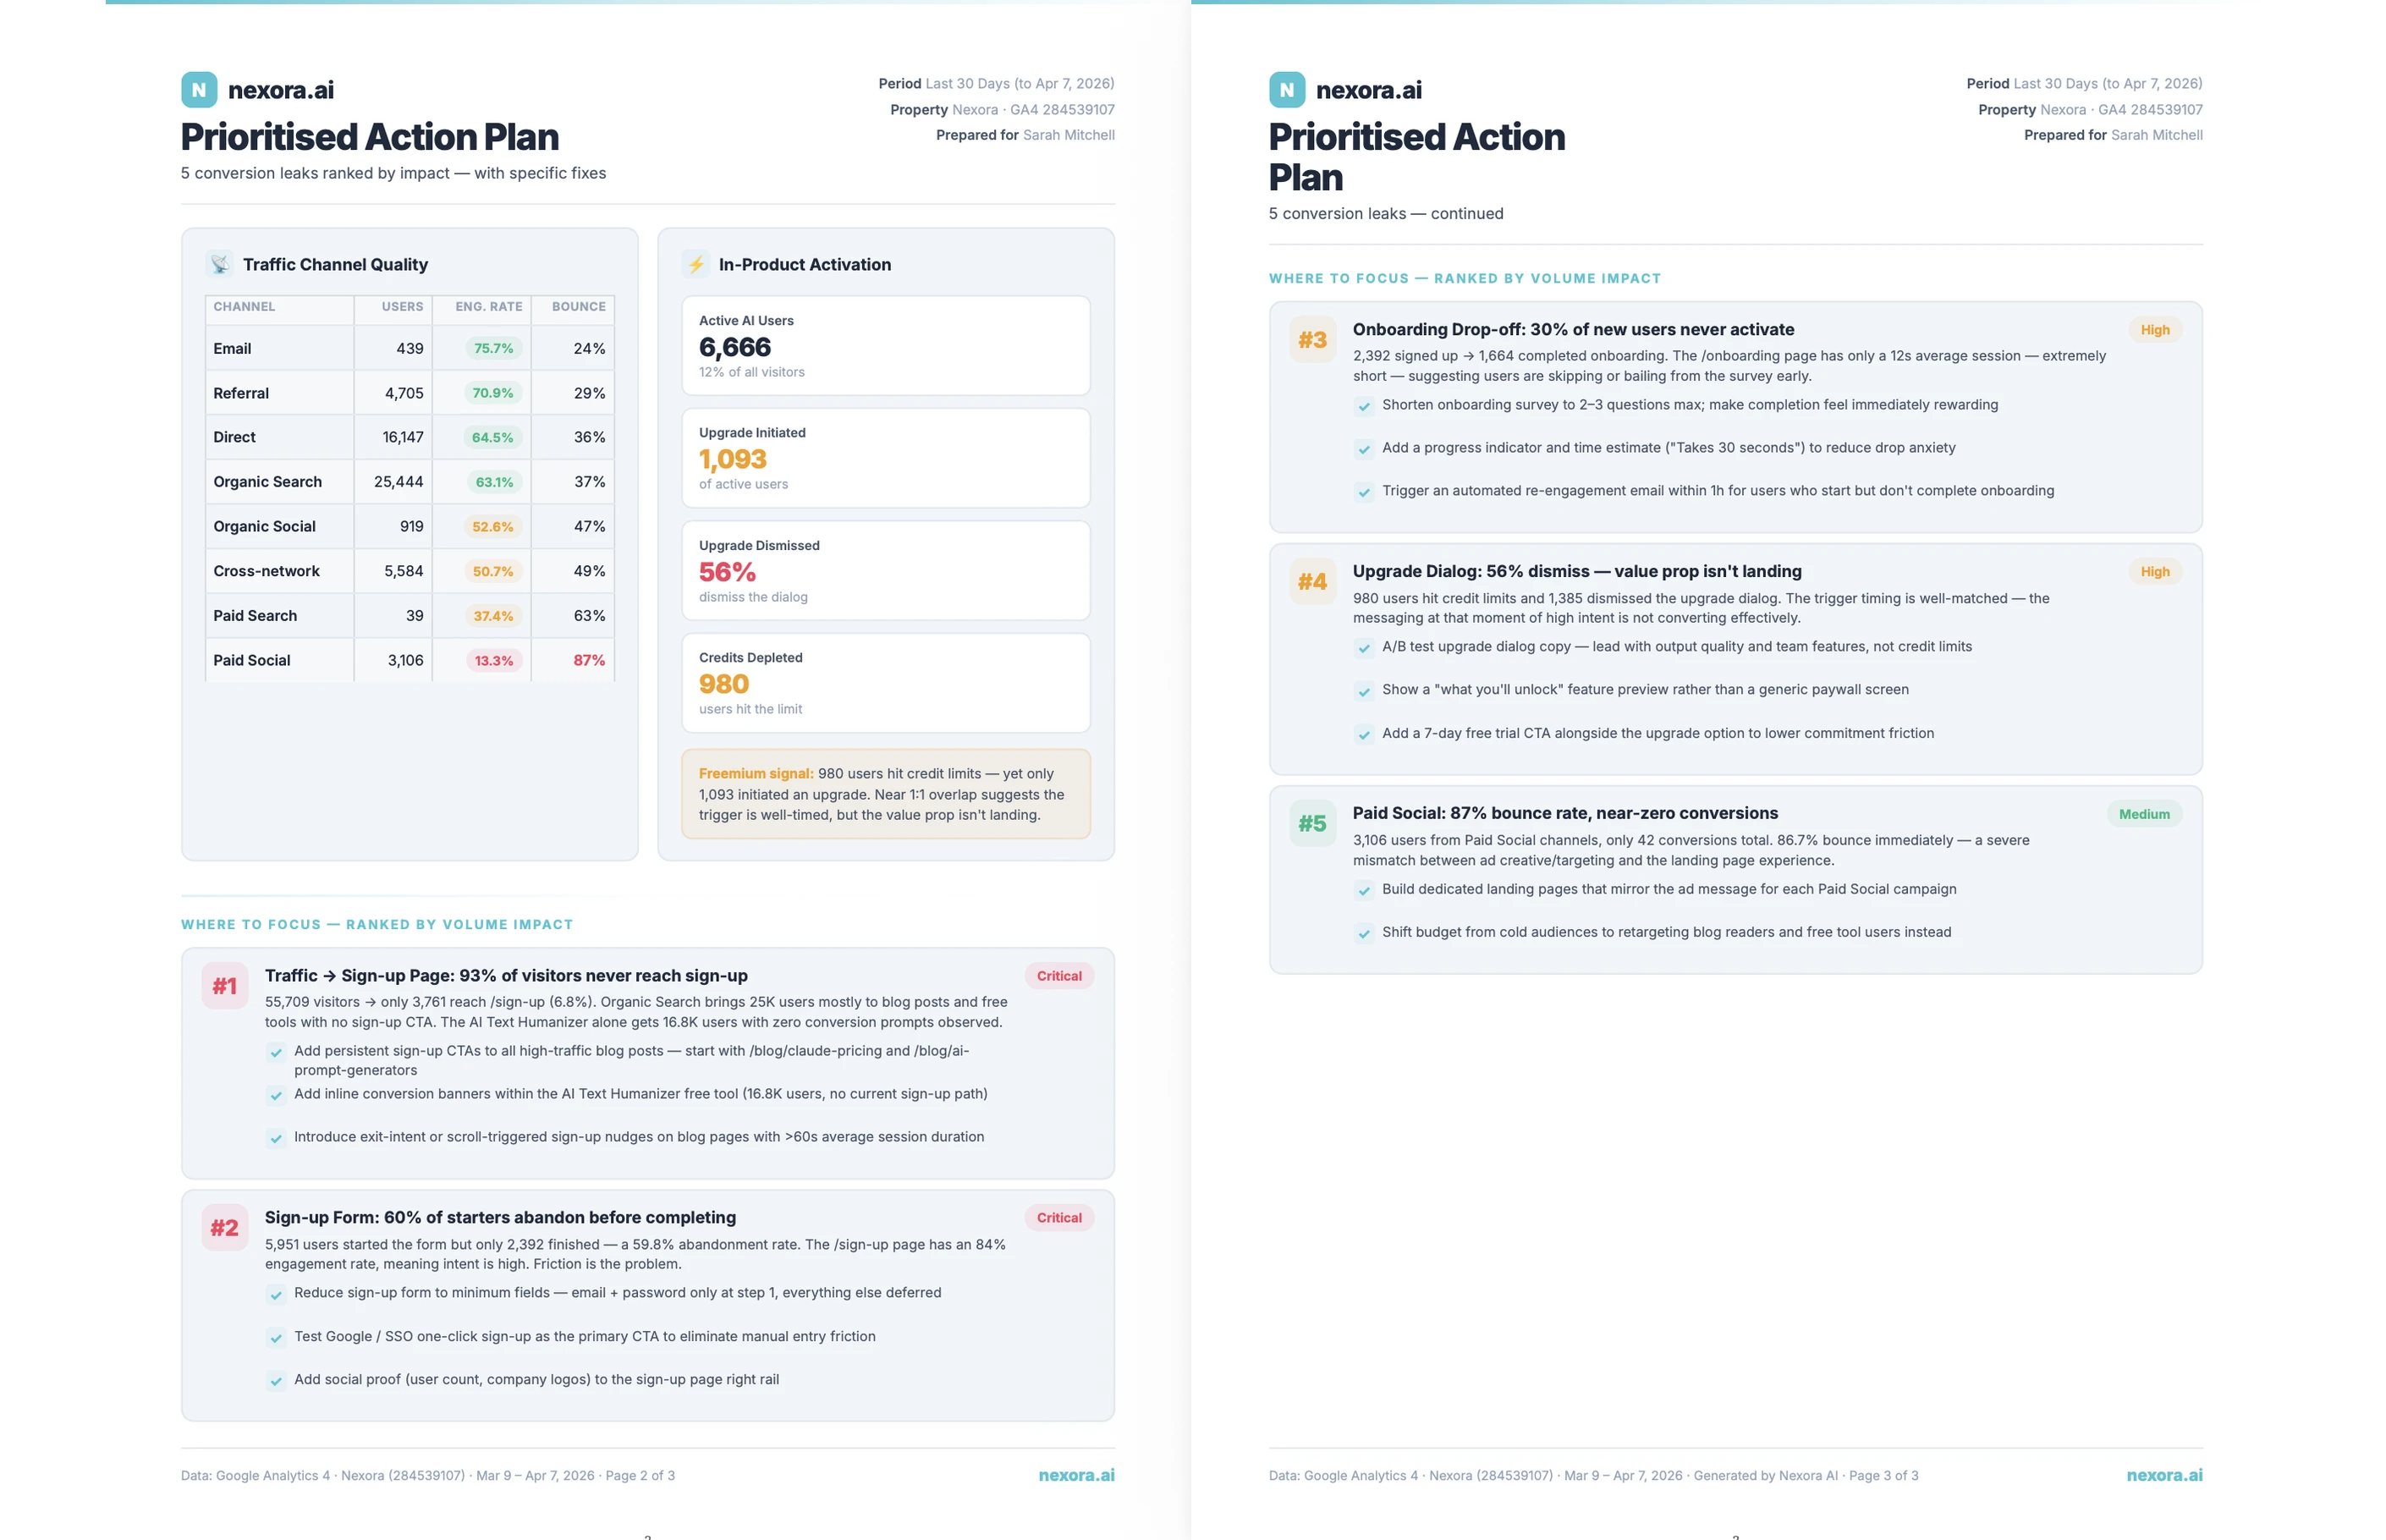
Website funnel analysis works best when the team maps funnel stages explicitly before running the Flow. For a marketing site, that means defining which page views or events mark the beginning and end of the conversion path. For a product flow, it means identifying the GA4 events or PostHog steps that correspond to each stage in the user journey. The more precisely the funnel is defined, the more accurate the drop-off rates. Specific event-to-stage mapping produces the granular breakdown that turns a funnel report into an actionable plan.