Set up your client project: channel targets and campaign context
Teams build one Juma project per client and add context over time. Every flow the team runs for that client pulls from the same project. If a project already exists, adding channel performance context means each comparison starts from the client's own targets and campaign history.
What to add
Channel Performance Targets
Target metrics per channel: CPA, ROAS, conversion rate, or cost per lead. When this exists, the analysis measures each channel against the client's own goals instead of comparing channels only to each other.
Campaign and Budget Context
Active campaigns, budget allocations, and any recent changes (paused campaigns, new ad groups, landing page tests). This gives the analysis context for interpreting performance differences rather than diagnosing from numbers alone.
Past Channel Reports
Previous channel comparisons from earlier periods. When present, the analysis tracks whether shifts in channel performance are trends or one-time anomalies. If analytics accounts are already connected, Juma can pull historical data directly.
Guide Juma with project info
Add a short description to each knowledge item in the project's info field so Juma knows what each file contains and when to use it. For example:
- Channel Performance Targets: "CPA and ROAS targets per channel. Measure each channel against these."
- Campaign and Budget Context: "Active campaigns and budget allocation. Reference when analyzing paid performance."
- Past Channel Reports: "Previous comparisons for trend tracking."
Find out which channels are actually converting
Frequently Asked Questions
How much time does this Flow save compared to building a channel comparison manually?
This Flow saves two to three hours per comparison. Manual channel comparisons require separate exports from GA4, Google Ads, and Google Search Console, date alignment across platforms, and manual formatting into one view. The Flow runs all three in one step and returns a formatted PDF with side-by-side funnels, device splits, and budget recommendations in minutes.
Each platform uses different attribution windows, different default metrics, and different date range defaults, so aligning them manually introduces errors as often as it saves time. A comparison that should take 30 minutes of analysis typically takes two to three hours once exports, reformatting, and cross-checking are accounted for.
For teams running this comparison regularly, the time saving compounds. A monthly channel review that previously required an afternoon becomes a ten-minute task. The consistency of the output means the team can track changes across reports without reformatting the data each time a comparison runs.
What does the conversion funnel analysis cover for each channel?
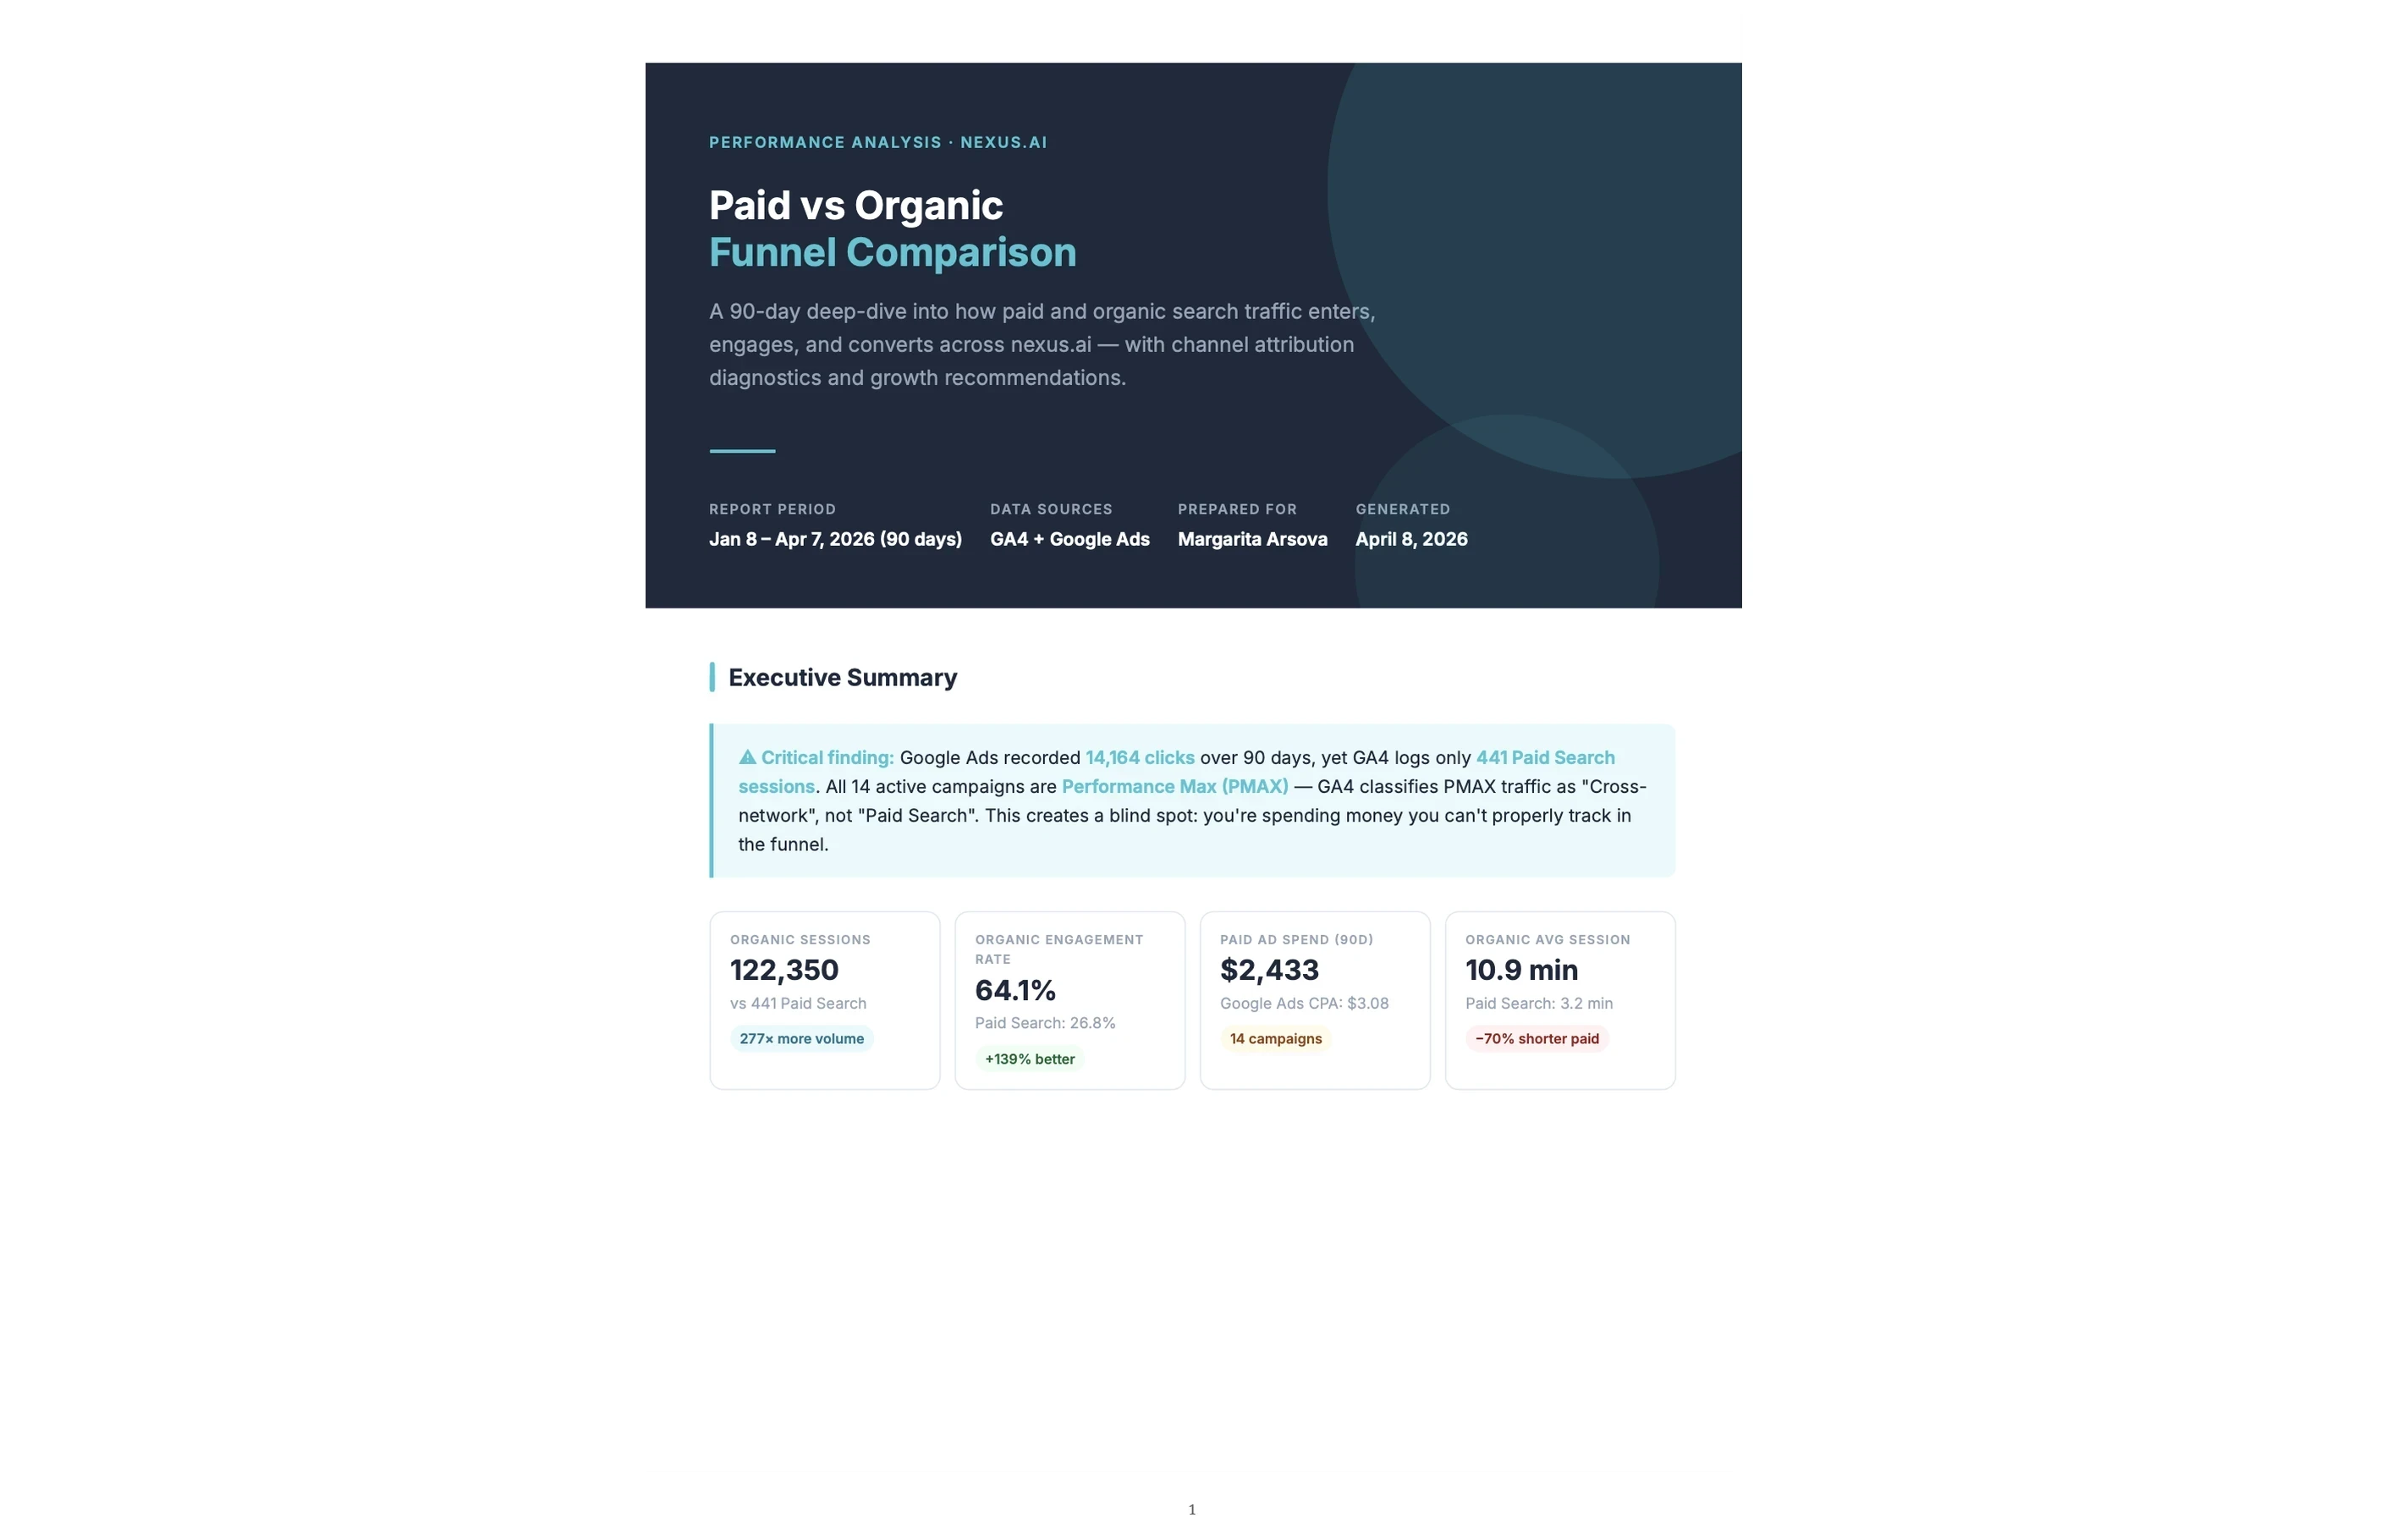
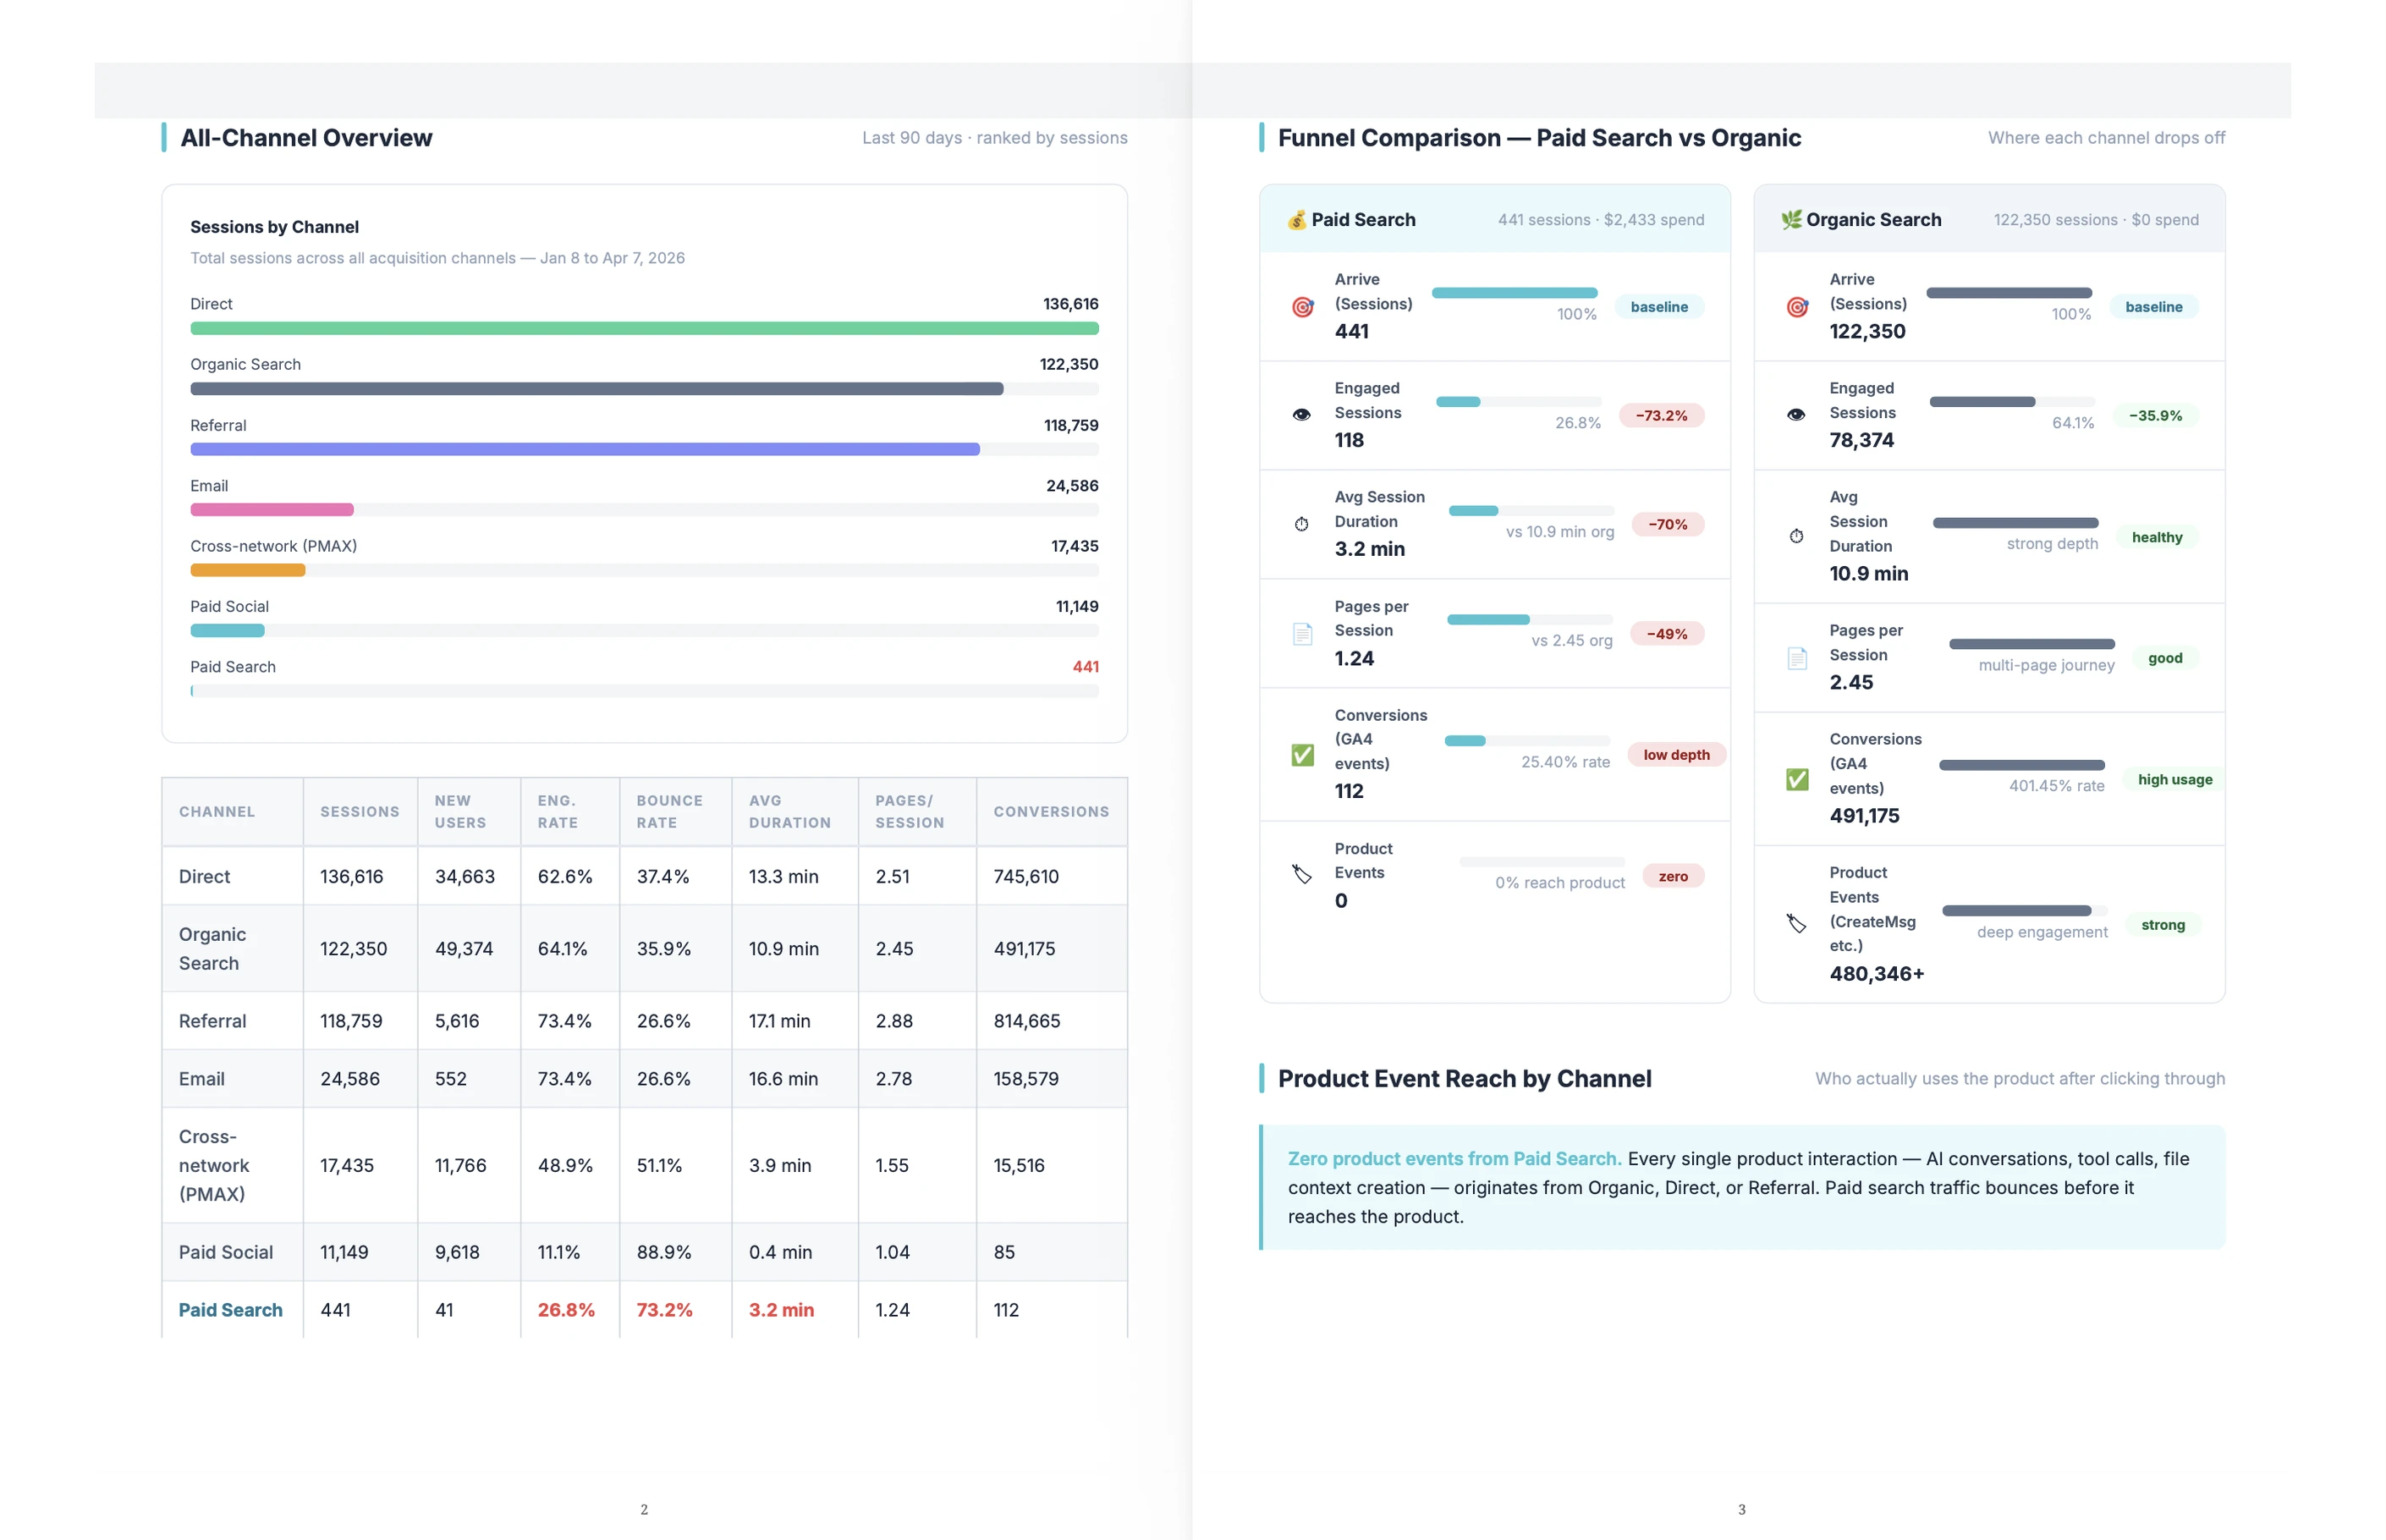
The conversion funnel analysis covers sessions, engagement rate, bounce rate, and conversion rate for each traffic channel at every funnel stage. Paid traffic also gets a campaign-level breakdown and a landing page comparison. The side-by-side view shows whether paid search and organic traffic drop off at the same stage or at different ones.
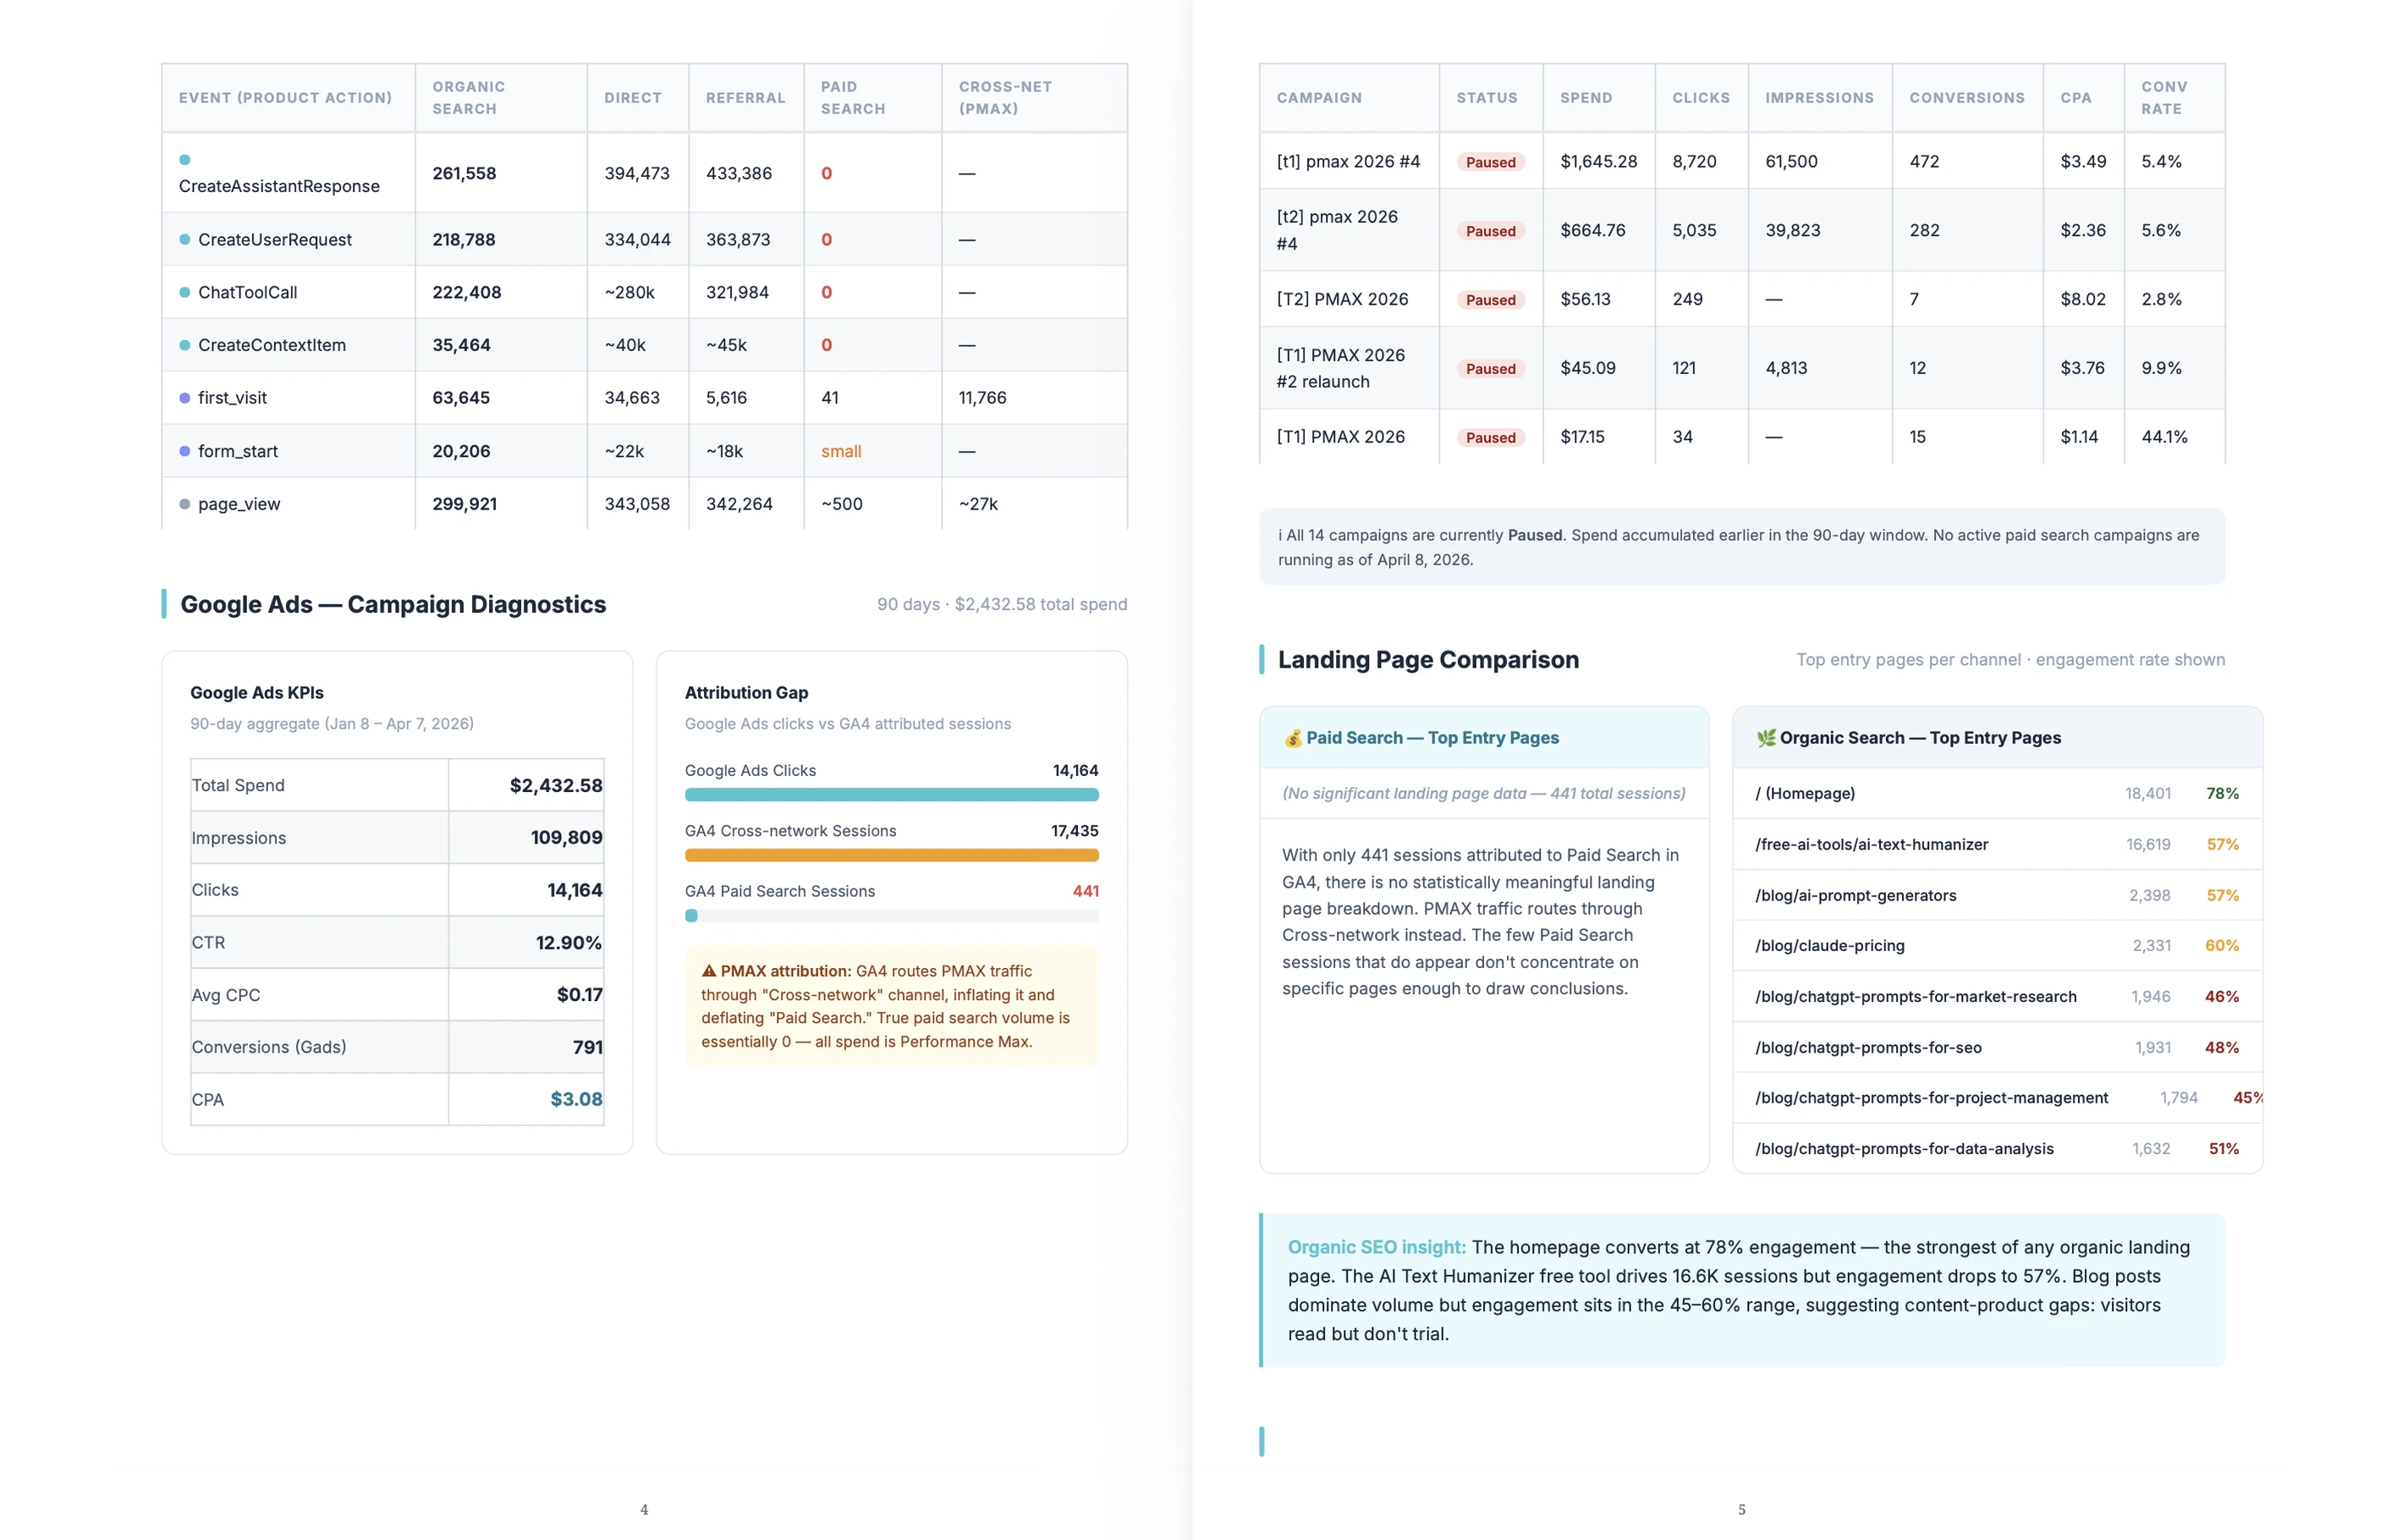
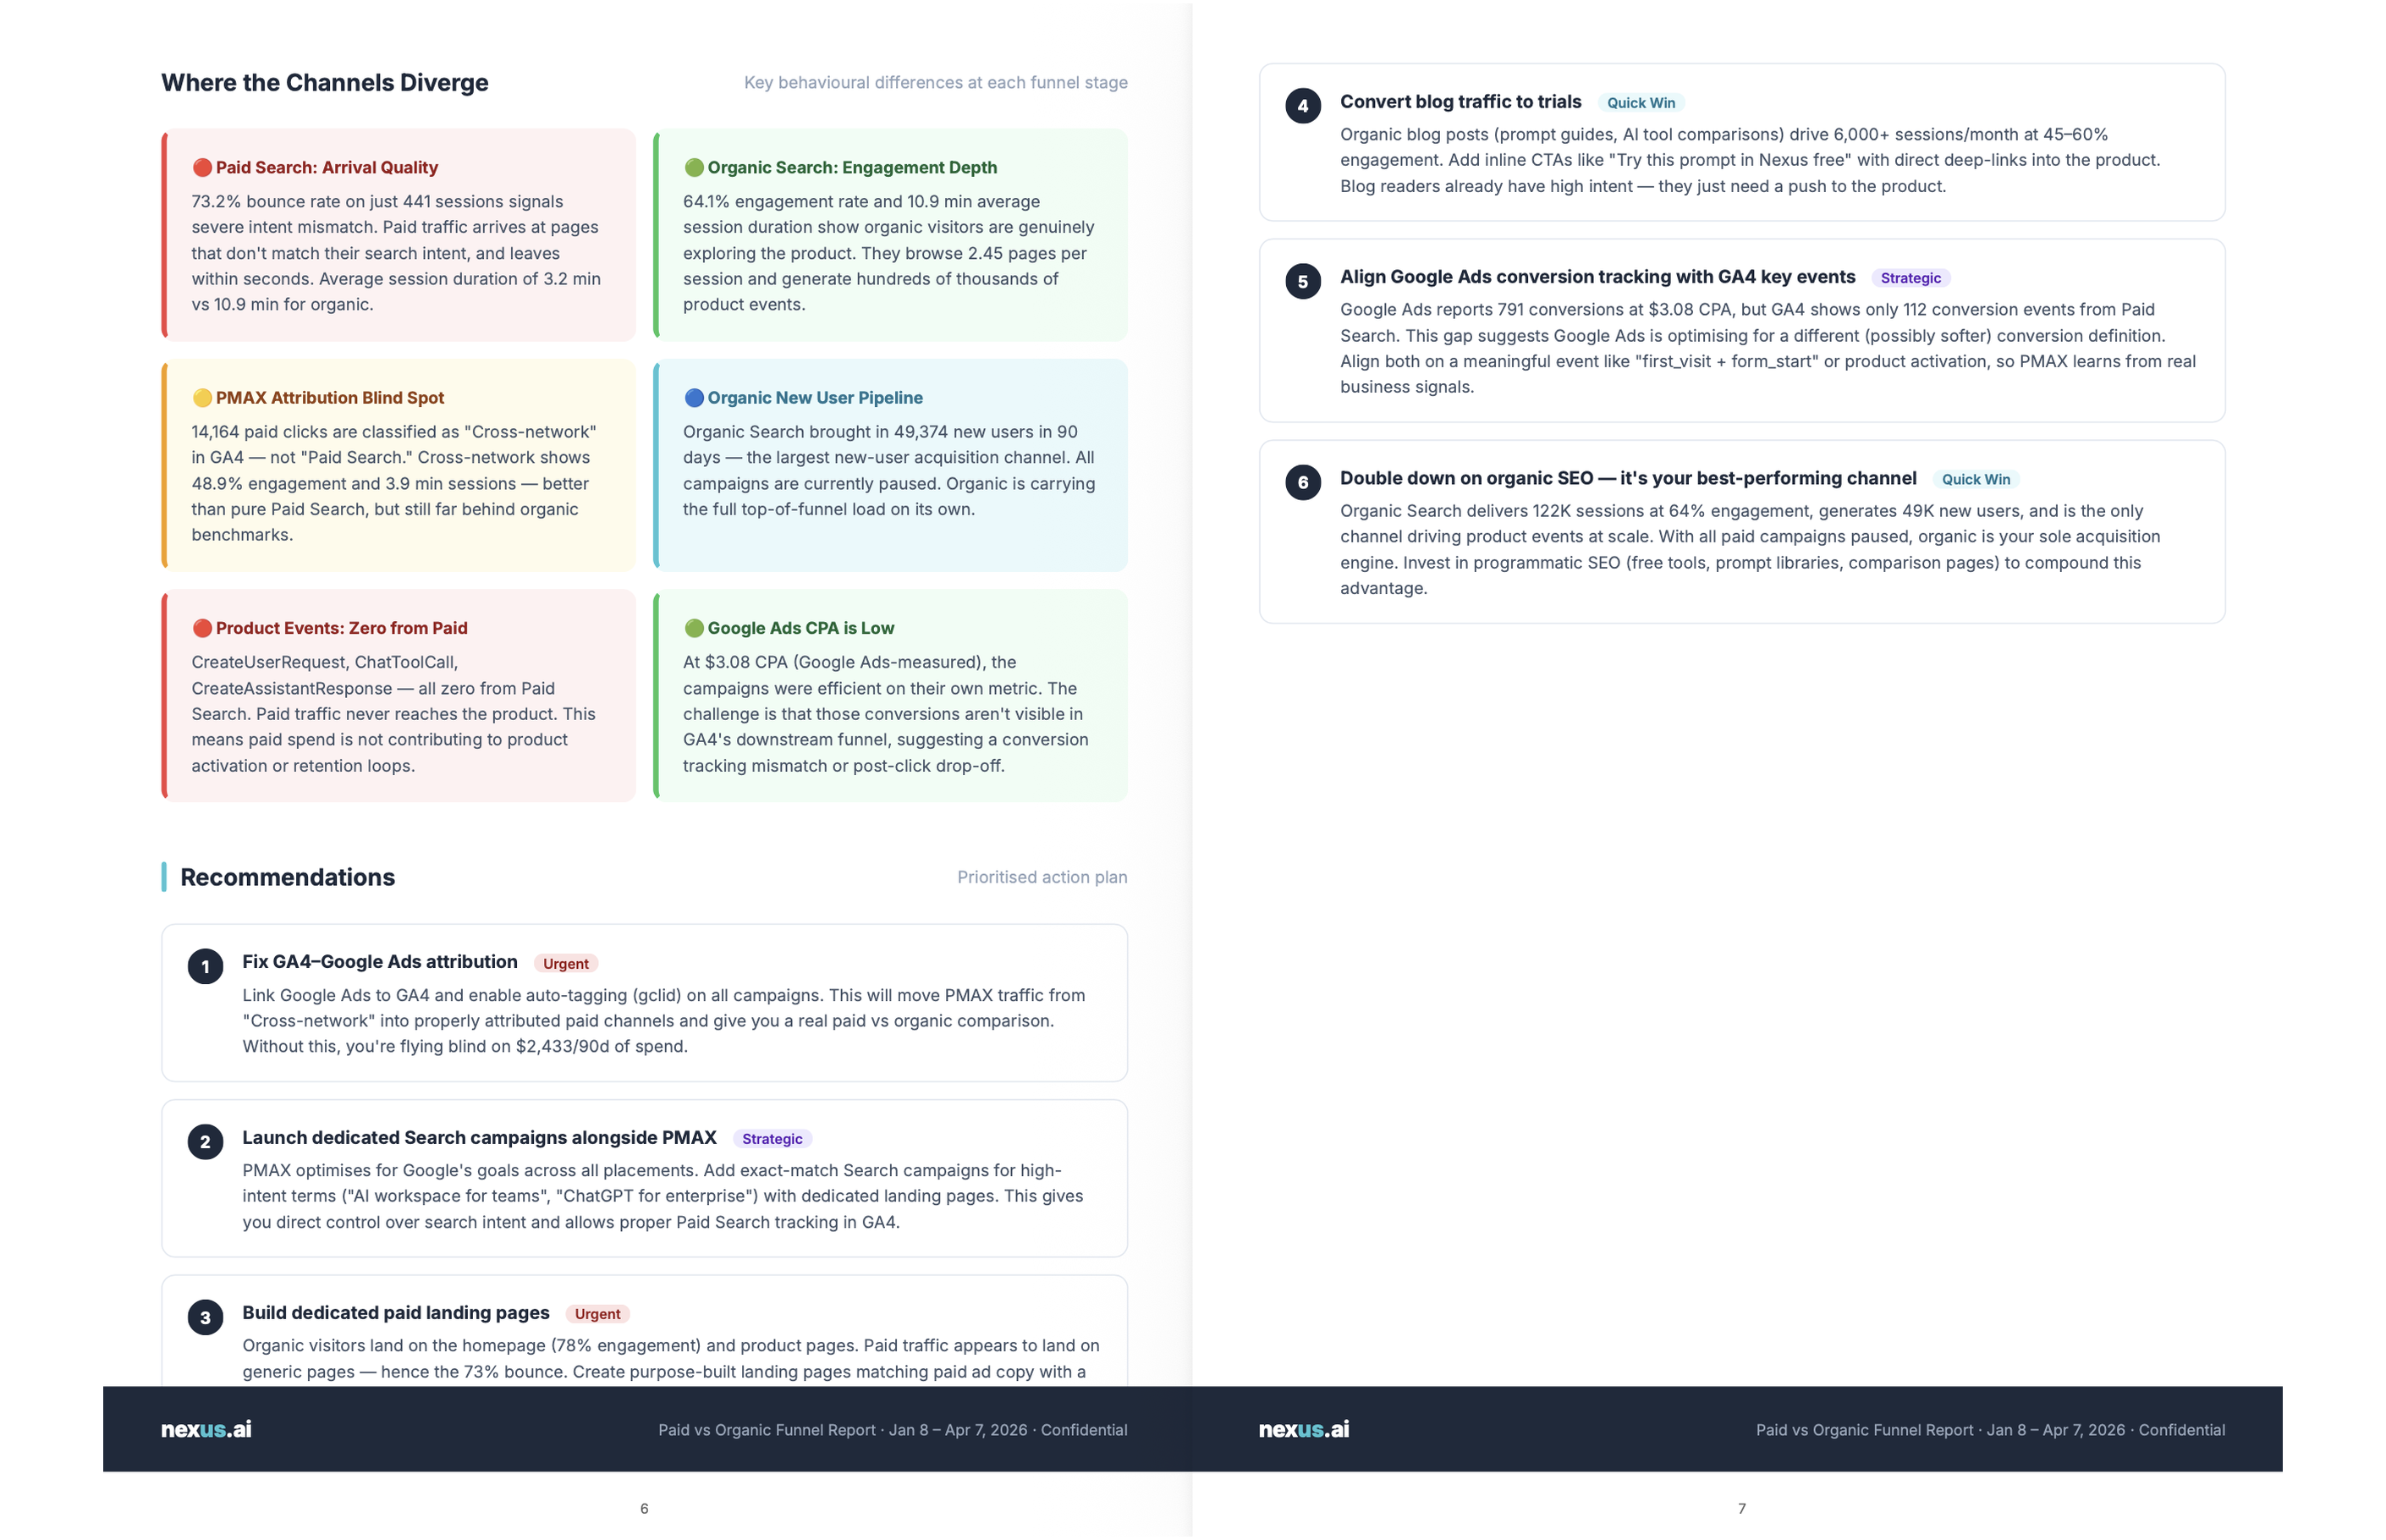
For paid traffic, the campaign-level breakdown shows which campaigns earn their budget and which ones produce no conversions at all. That level of detail is not visible in a channel-level view, but it is often where the largest efficiency gains sit. A channel that looks like it underperforms might have two campaigns dragging the average down while three others perform well.
The landing page comparison shows which pages each channel routes traffic to and how those pages convert. The same product page can produce a 5x conversion rate difference depending on whether the visitor arrived from a Google Ad or an organic search result.
What data sources does the analysis pull from?
The analysis pulls from the three sources that sit at the core of marketing channel attribution: Google Analytics (GA4), Google Ads, and Google Search Console. GA4 provides funnel and behavioral data, Google Ads adds spend and campaign metrics, and Search Console adds organic keyword performance. All three can connect live, or you can upload CSV exports and screenshots from each platform instead.
These are the same data sources that multi channel attribution tools rely on to measure how each channel contributes to conversions. Live connections pull current data in one step without manual exports, and the comparison can run again at any time without re-uploading files.
If you have not connected those accounts yet, uploading CSV exports or screenshots from each platform works too. The comparison runs from whatever data is available. Live connections are faster to repeat and add cost data automatically, but the analysis does not require live integrations to produce a complete channel comparison.
Does this Flow work if analytics accounts are not connected yet?
Yes. This Flow works without live analytics connections. Uploading CSV exports or screenshots from GA4, Google Ads, and Google Search Console gives it enough data to build a full channel comparison. Live connections make the analysis faster to repeat and add cost data automatically, but connected accounts are not required to run the Flow.
For teams that have data across multiple platforms but have not connected those accounts to Juma yet, the upload path covers most use cases. GA4 exports include sessions, engagement, and conversion data. Google Ads exports include spend, impressions, clicks, and conversions by campaign. Uploading both gives the website funnel analysis the cost and behavioral data it needs for a complete comparison.
After connecting Google Analytics, Google Ads, and Google Search Console, the team can run the comparison again at any time without exporting and re-uploading files. For teams that run this comparison monthly, that repeatability is where live connections pay off most.