Set up your client project: activation definitions and onboarding context
Teams build one Juma project per client and add context over time. Every flow the team runs for that client pulls from the same project. If a project already exists, adding activation context means each diagnostic starts from the client's own definitions and benchmarks.
What to add
Activation Event Definitions
What counts as "activated" for this product, mapped to the analytics event name. Also include any intermediate events that define the onboarding journey (signup, email verified, profile completed, first action). When this exists, the diagnostic uses the client's actual activation criteria rather than inferring them.
Onboarding Flow Description
The intended onboarding sequence: which steps a new user goes through, what each step asks them to do, and where the team expects the biggest friction. This gives the analysis a map to compare against the data, so it can flag steps where real behavior diverges from the designed flow.
Activation Targets
Target activation rate, acceptable time-to-activate, and historical baselines. With this in the project, every diagnostic measures against the client's own goals instead of SaaS industry benchmarks.
Guide Juma with project info
Add a short description to each knowledge item in the project's info field so Juma knows what each file contains and when to use it. For example:
- Activation Event Definitions: "Event names for each activation step. Read this before pulling funnel data."
- Onboarding Flow Description: "Intended user journey from signup to activation. Compare real behavior against this."
- Activation Targets: "The client's own activation rate targets. Measure against these, not industry averages."
Find out why signups aren't becoming active users
Frequently Asked Questions
How much time does this Flow save compared to building the analysis manually?
This Flow returns a complete user activation diagnostic, including the tracking validation check most teams skip manually, in minutes. The equivalent manual process takes a product or growth analyst several hours to a full day, requiring data from multiple sources, per-step drop-off calculations, and event count reconciliation across platforms.
Most teams skip the instrumentation validation step entirely because it requires comparing event counts across different tools and judging whether the ratios are statistically plausible. This is the step where manual analysis is most likely to produce a costly misdiagnosis.
The time saving is largest on the tracking validation piece. This is the check that most often changes what the team decides to fix first, and the one that separates a product redesign decision from an engineering fix.
What does the activation funnel diagnostic actually include?
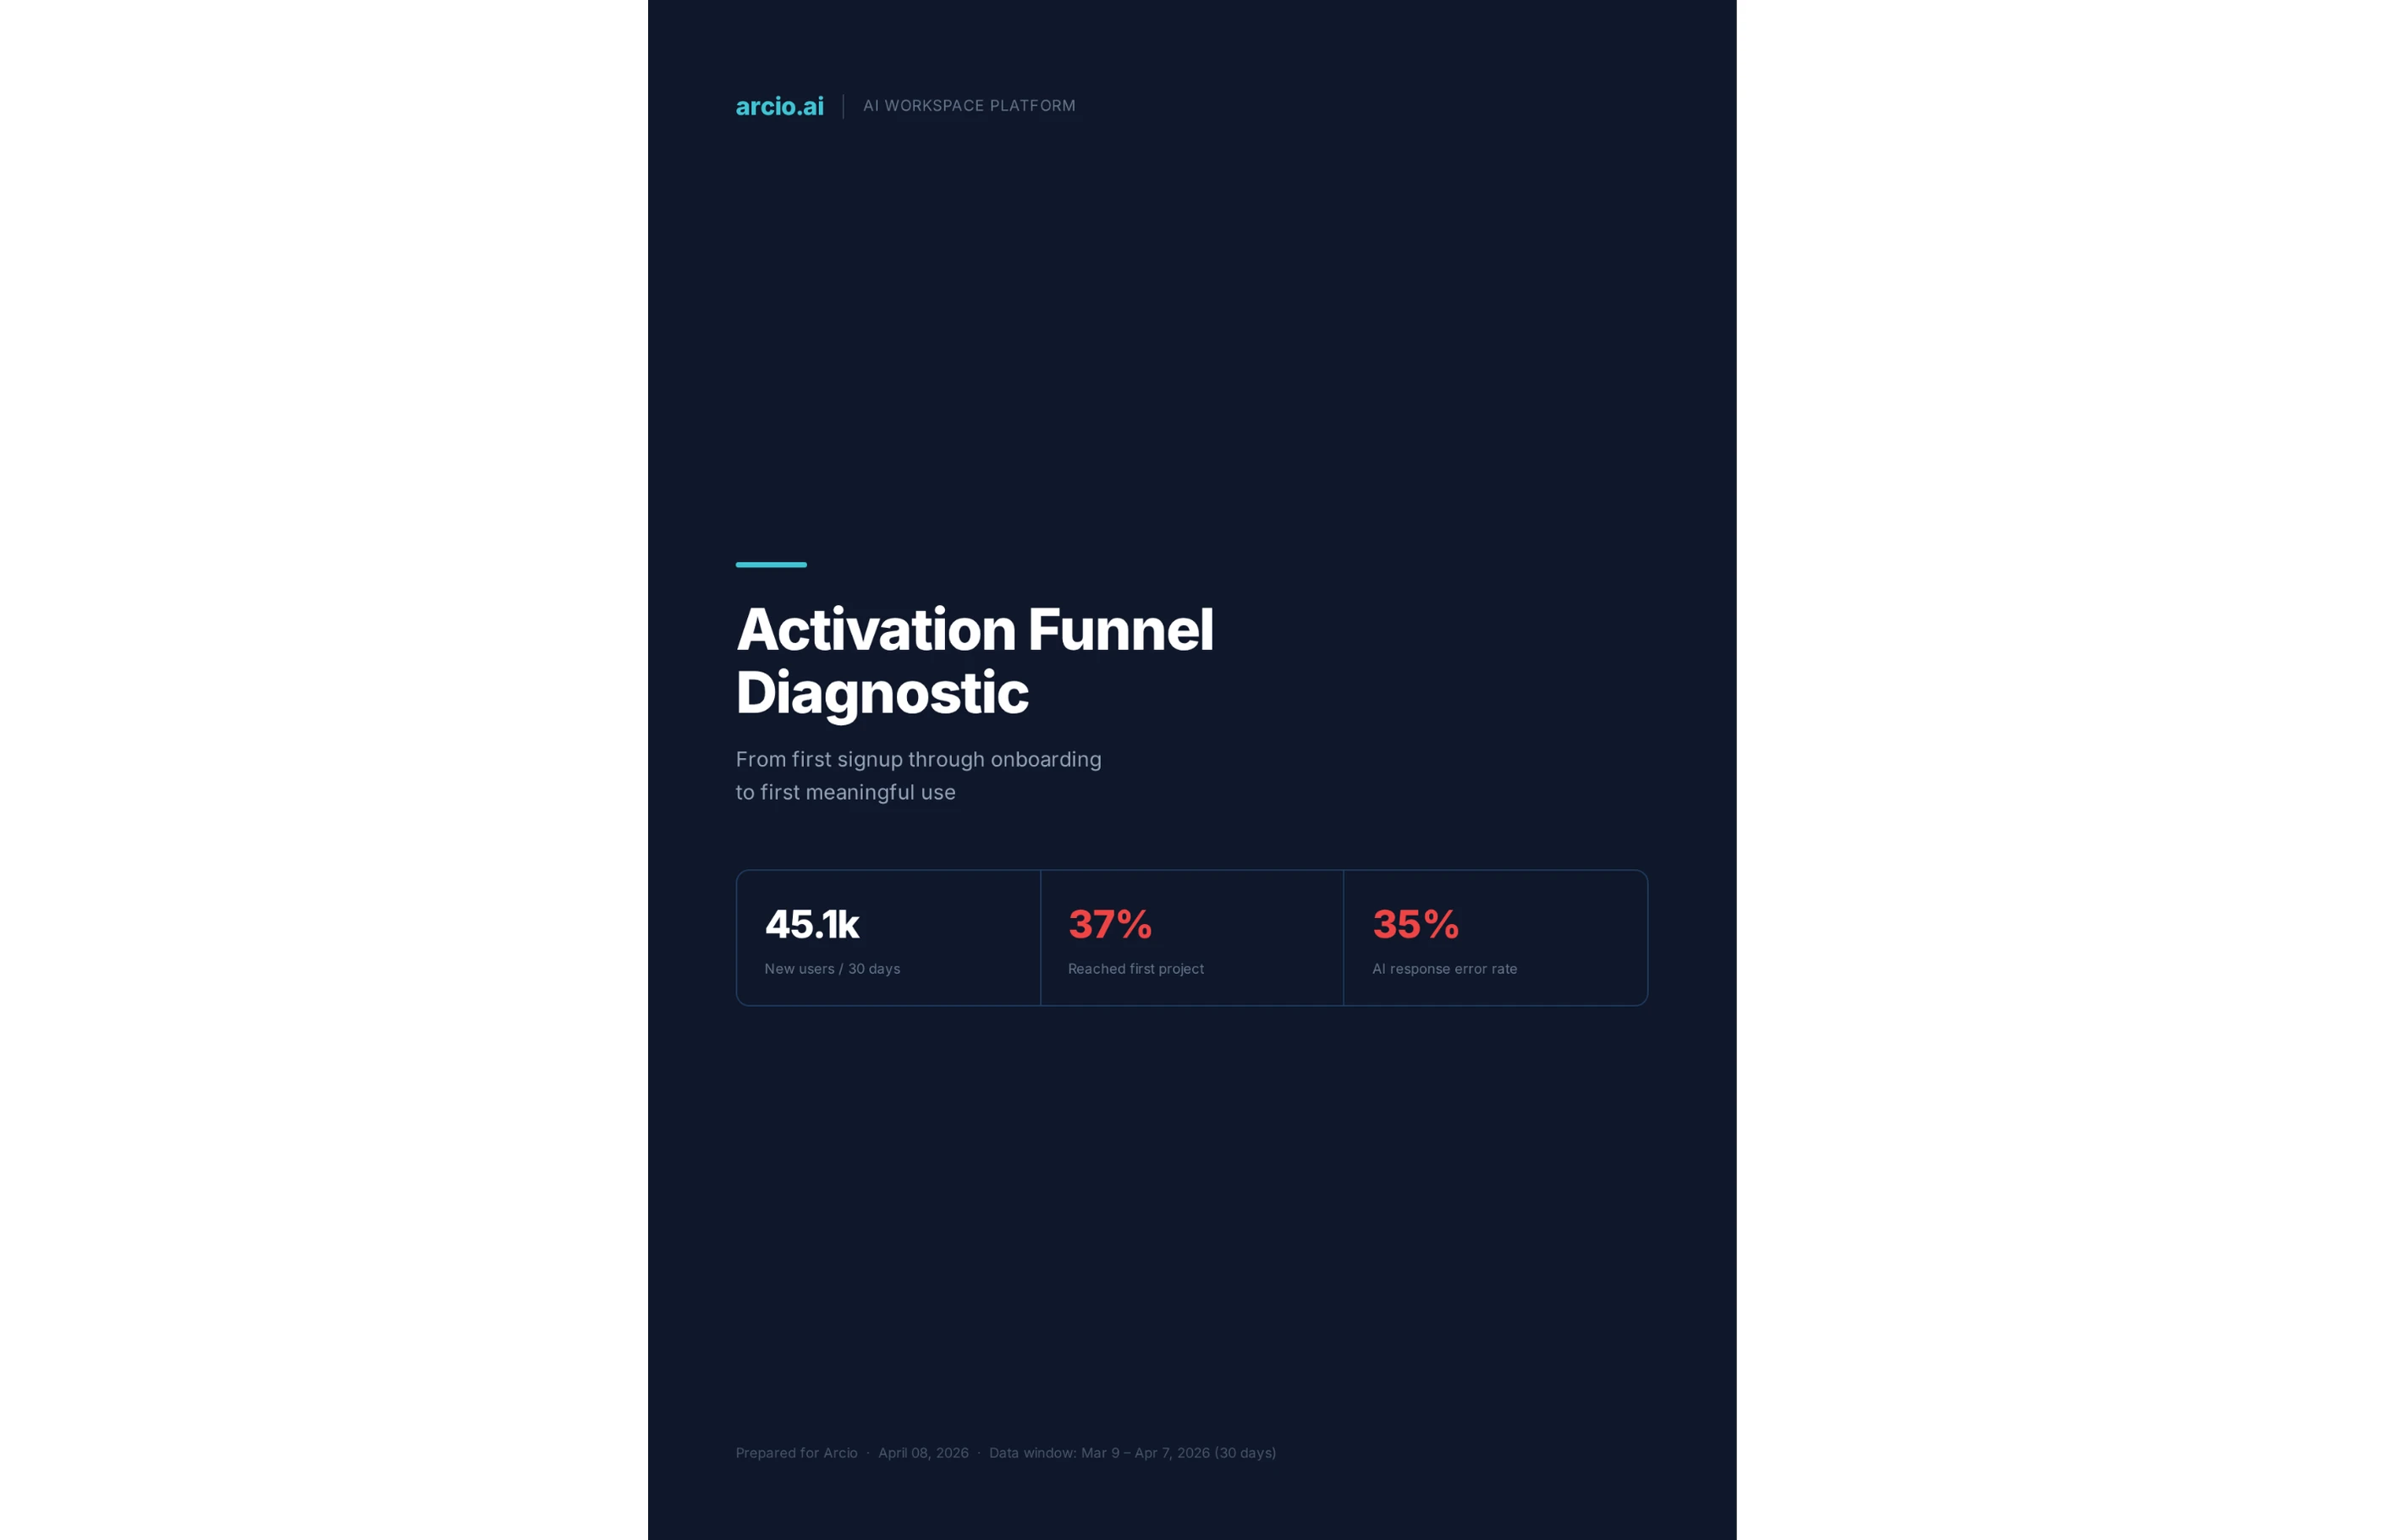
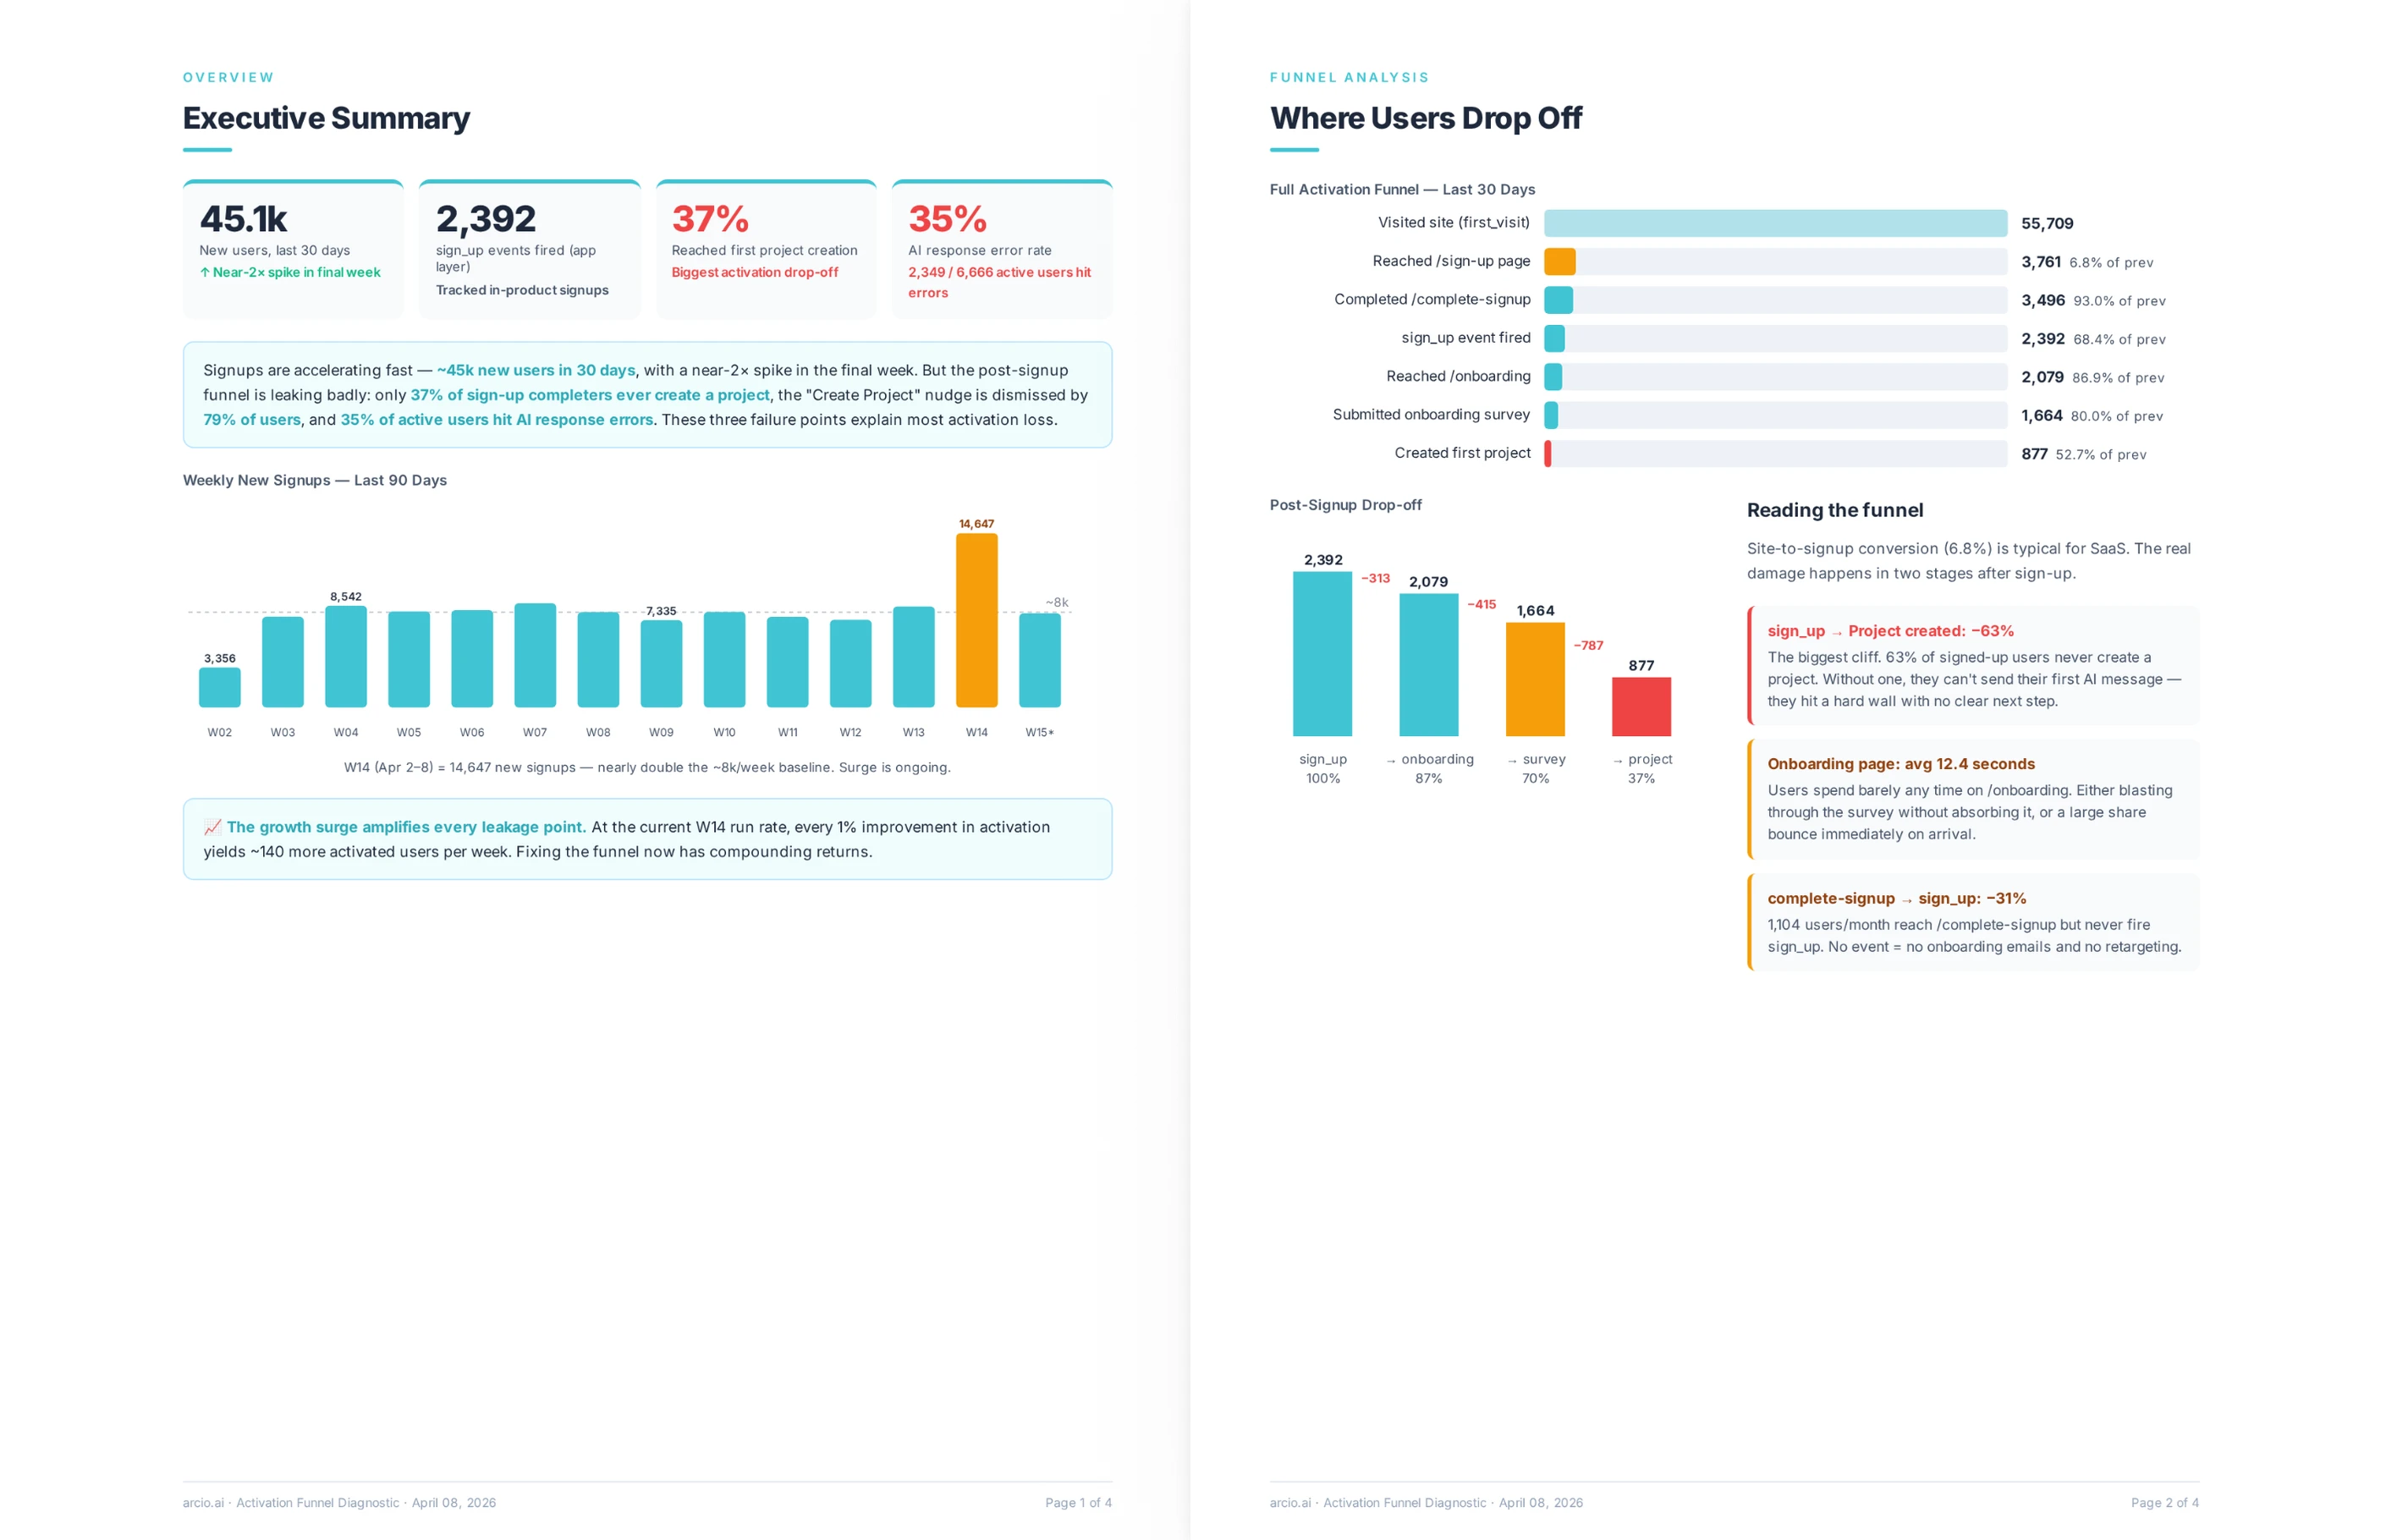
The diagnostic maps the full user activation journey from first signup through each onboarding step to the first meaningful action. It shows how many users arrived at each stage and how many completed it, and color-codes the severity of each drop-off so critical losses are immediately visible.
Beyond drop-off rates, the analysis looks for behavioral patterns the team may not spot in a standard funnel dashboard. Looping behavior, where users cycle through the same onboarding steps more than once, often signals a confusing or circular flow rather than low user motivation. Exit points that correlate with specific steps reveal friction the team can remove or delay.
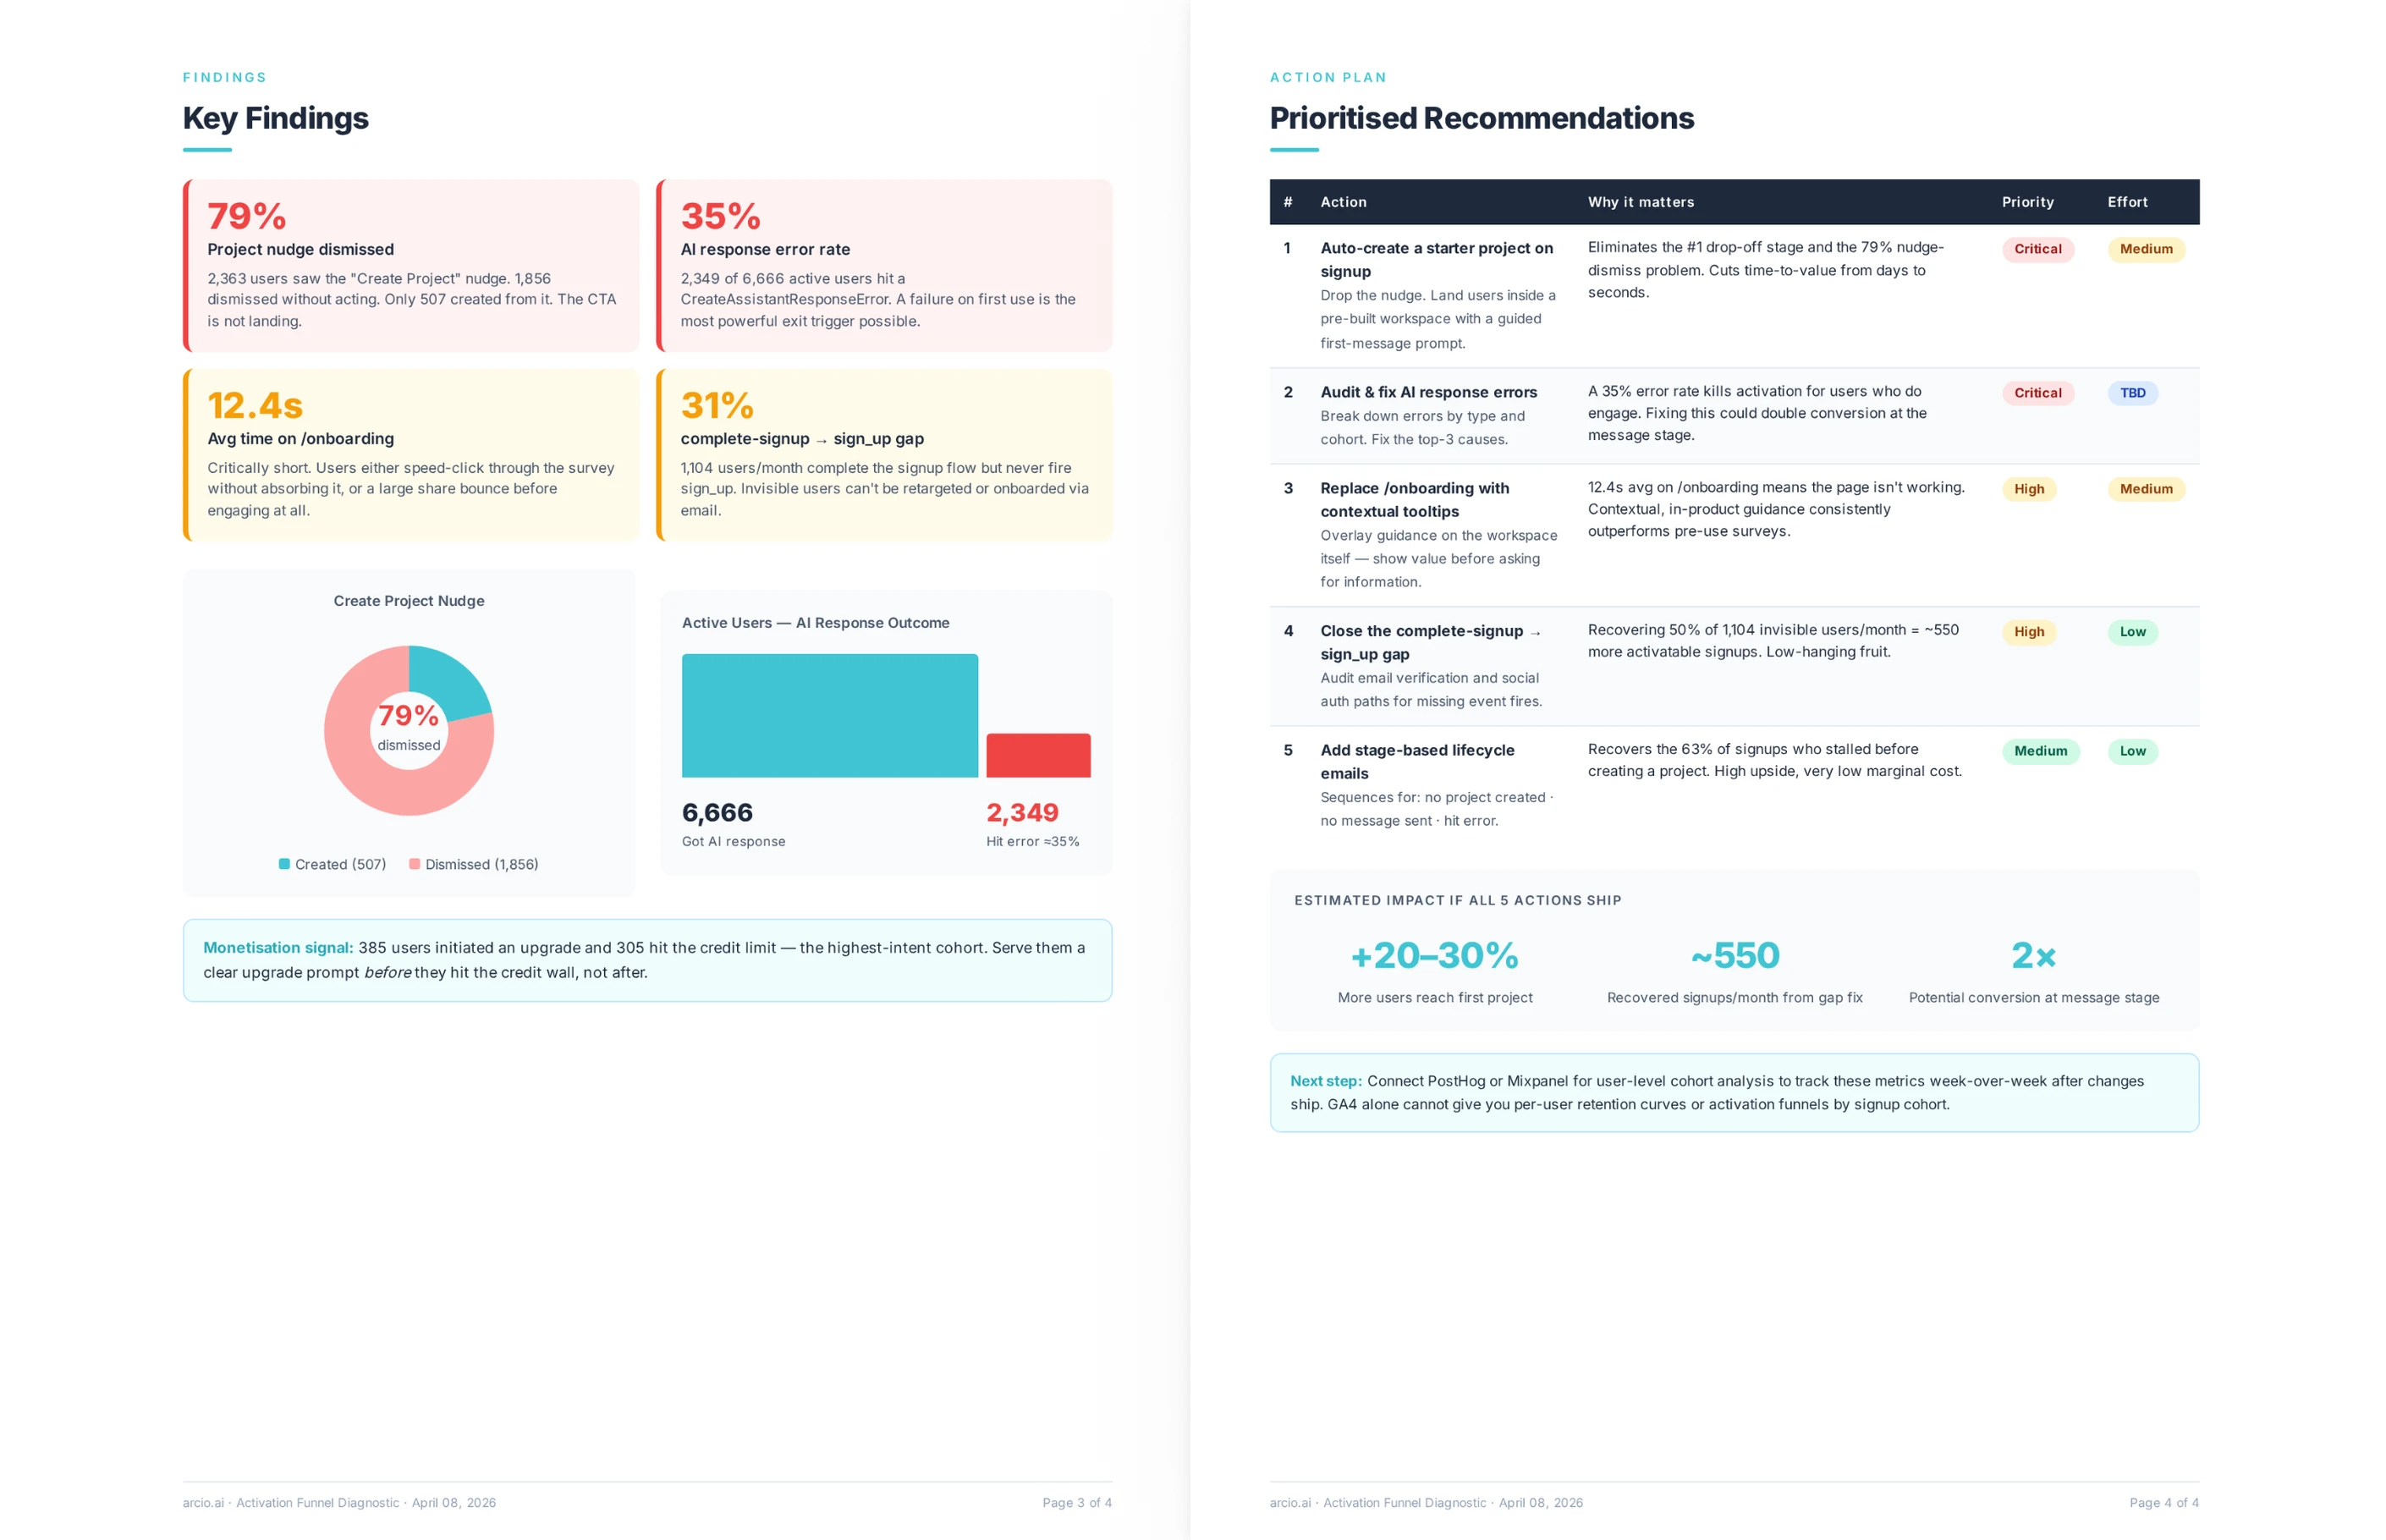
Each finding connects to a recommendation, so the diagnostic does not just describe the problem but gives the team a clear starting point for fixing it.
How does the tracking validation check work?
The check compares related event counts that should correlate, such as activation events against messaging or engagement events from the same period. When the ratio between two related events is statistically implausible, the diagnostic flags it as a likely instrumentation problem rather than real user behavior.
The most common version of this problem is a steep drop-off between an onboarding completion event and an activation event. If 26,000 users triggered the onboarding completion event but only 17 triggered the activation event in the same period, the activation event is almost certainly misfiring, not reflecting a real user behavior pattern.
This distinction changes the fix entirely. A real user drop-off requires a product change. A broken event requires an engineering fix. Without the cross-reference check, teams routinely spend months redesigning an onboarding flow that was never the actual problem.
What does the Flow need to run the analysis?
A description of the product and the intended onboarding funnel is enough to get started. The more detail the team provides about the intended user journey, the more precisely the analysis can identify where real behavior diverges from the designed path.
Live connections to PostHog or Google Analytics pull real event-level data automatically and enable the full tracking validation check. PostHog provides the most detailed view, capturing in-product events and user paths that GA4 does not capture at the same level of granularity.
Teams without a connected analytics tool can share event data exports, screenshots of their funnel dashboard, or a written description of the intended flow. The diagnostic runs from any of these inputs and returns a complete analysis, though live connections produce the most reliable tracking validation results.