Set up your client project: performance targets and campaign context
Teams build one Juma project per client and add context over time. Every flow the team runs for that client pulls from the same project. If a project already exists, adding ad performance context means each analysis starts from the client's targets and history instead of industry benchmarks alone.
What to add
Campaign Analysis Context
Performance targets by channel (target CPA, target ROAS, budget caps), which campaigns to prioritize, and standing constraints. With this in the project, every analysis measures against the client's own goals instead of asking about them each time.
Past Performance Data
Historical baselines: last quarter's CPA, ROAS, and conversion volume by campaign. When this exists, the analysis compares against the client's own trajectory, not just industry averages. If the client's ad account is already connected, Juma can pull historical data directly, so this file becomes optional.
Client Brief
Company context, product lines, target audience, competitive positioning. This gives the analysis business context so recommendations connect to strategy, not just numbers.
Guide Juma with project info
Add a short description to each knowledge item in the project's info field so Juma knows what each file contains and when to use it. For example:
- Campaign Analysis Context: "Google Ads targets and constraints. Read this before pulling data."
- Past Performance Data: "Historical CPA and ROAS by campaign. Compare current results against these baselines."
- Client Brief: "Company context for strategic framing of recommendations."
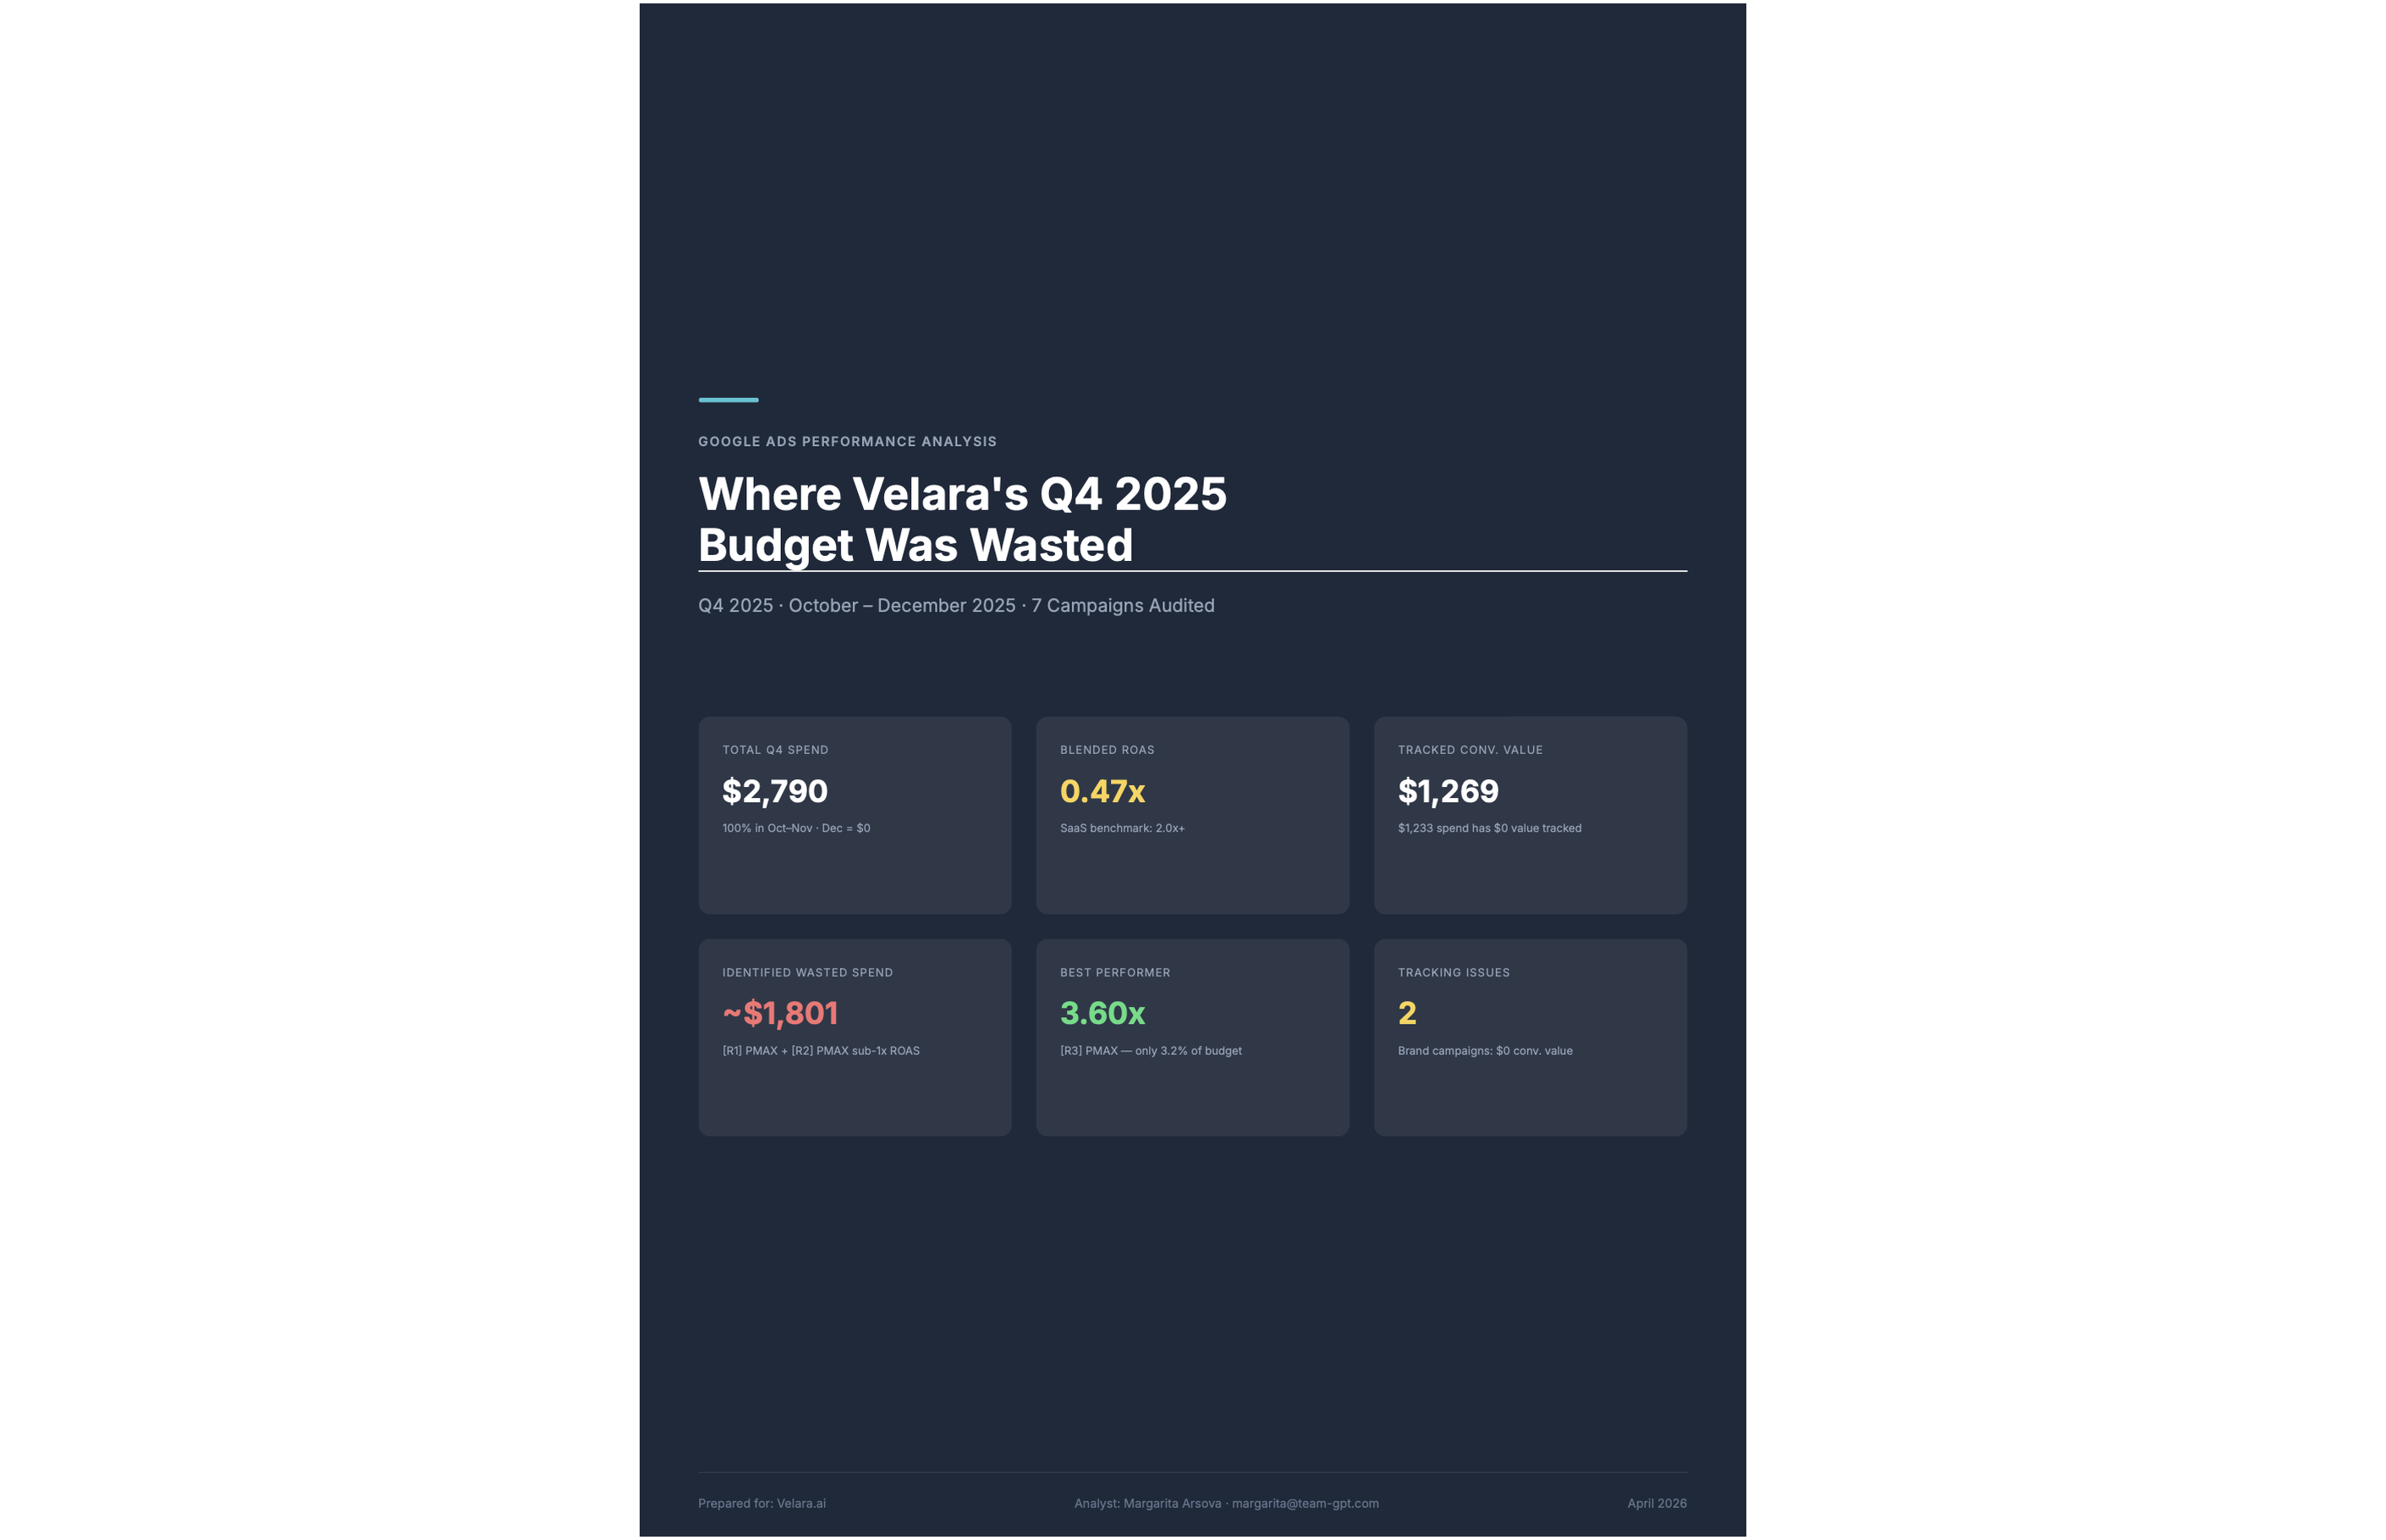
See where your ad budget is actually going
Frequently Asked Questions
How much time does this Flow save compared to running a Google Ads audit manually?
Running a Google Ads audit manually takes 2 to 4 hours per account to cover campaign settings, budget pacing, conversion tracking, and performance comparisons. Juma completes the same analysis in minutes and delivers a formatted, client-ready PDF. Teams auditing multiple accounts per month recover the equivalent of a full working day each month without sacrificing depth or consistency.
For agencies running audits across multiple client accounts, the time savings compound. A team auditing four accounts per month recovers roughly 8 to 16 hours of analysis work monthly, and the output is more consistent because the same structure applies to every account. There is no variation in what gets checked based on who runs the audit.
What does the campaign scorecard include?
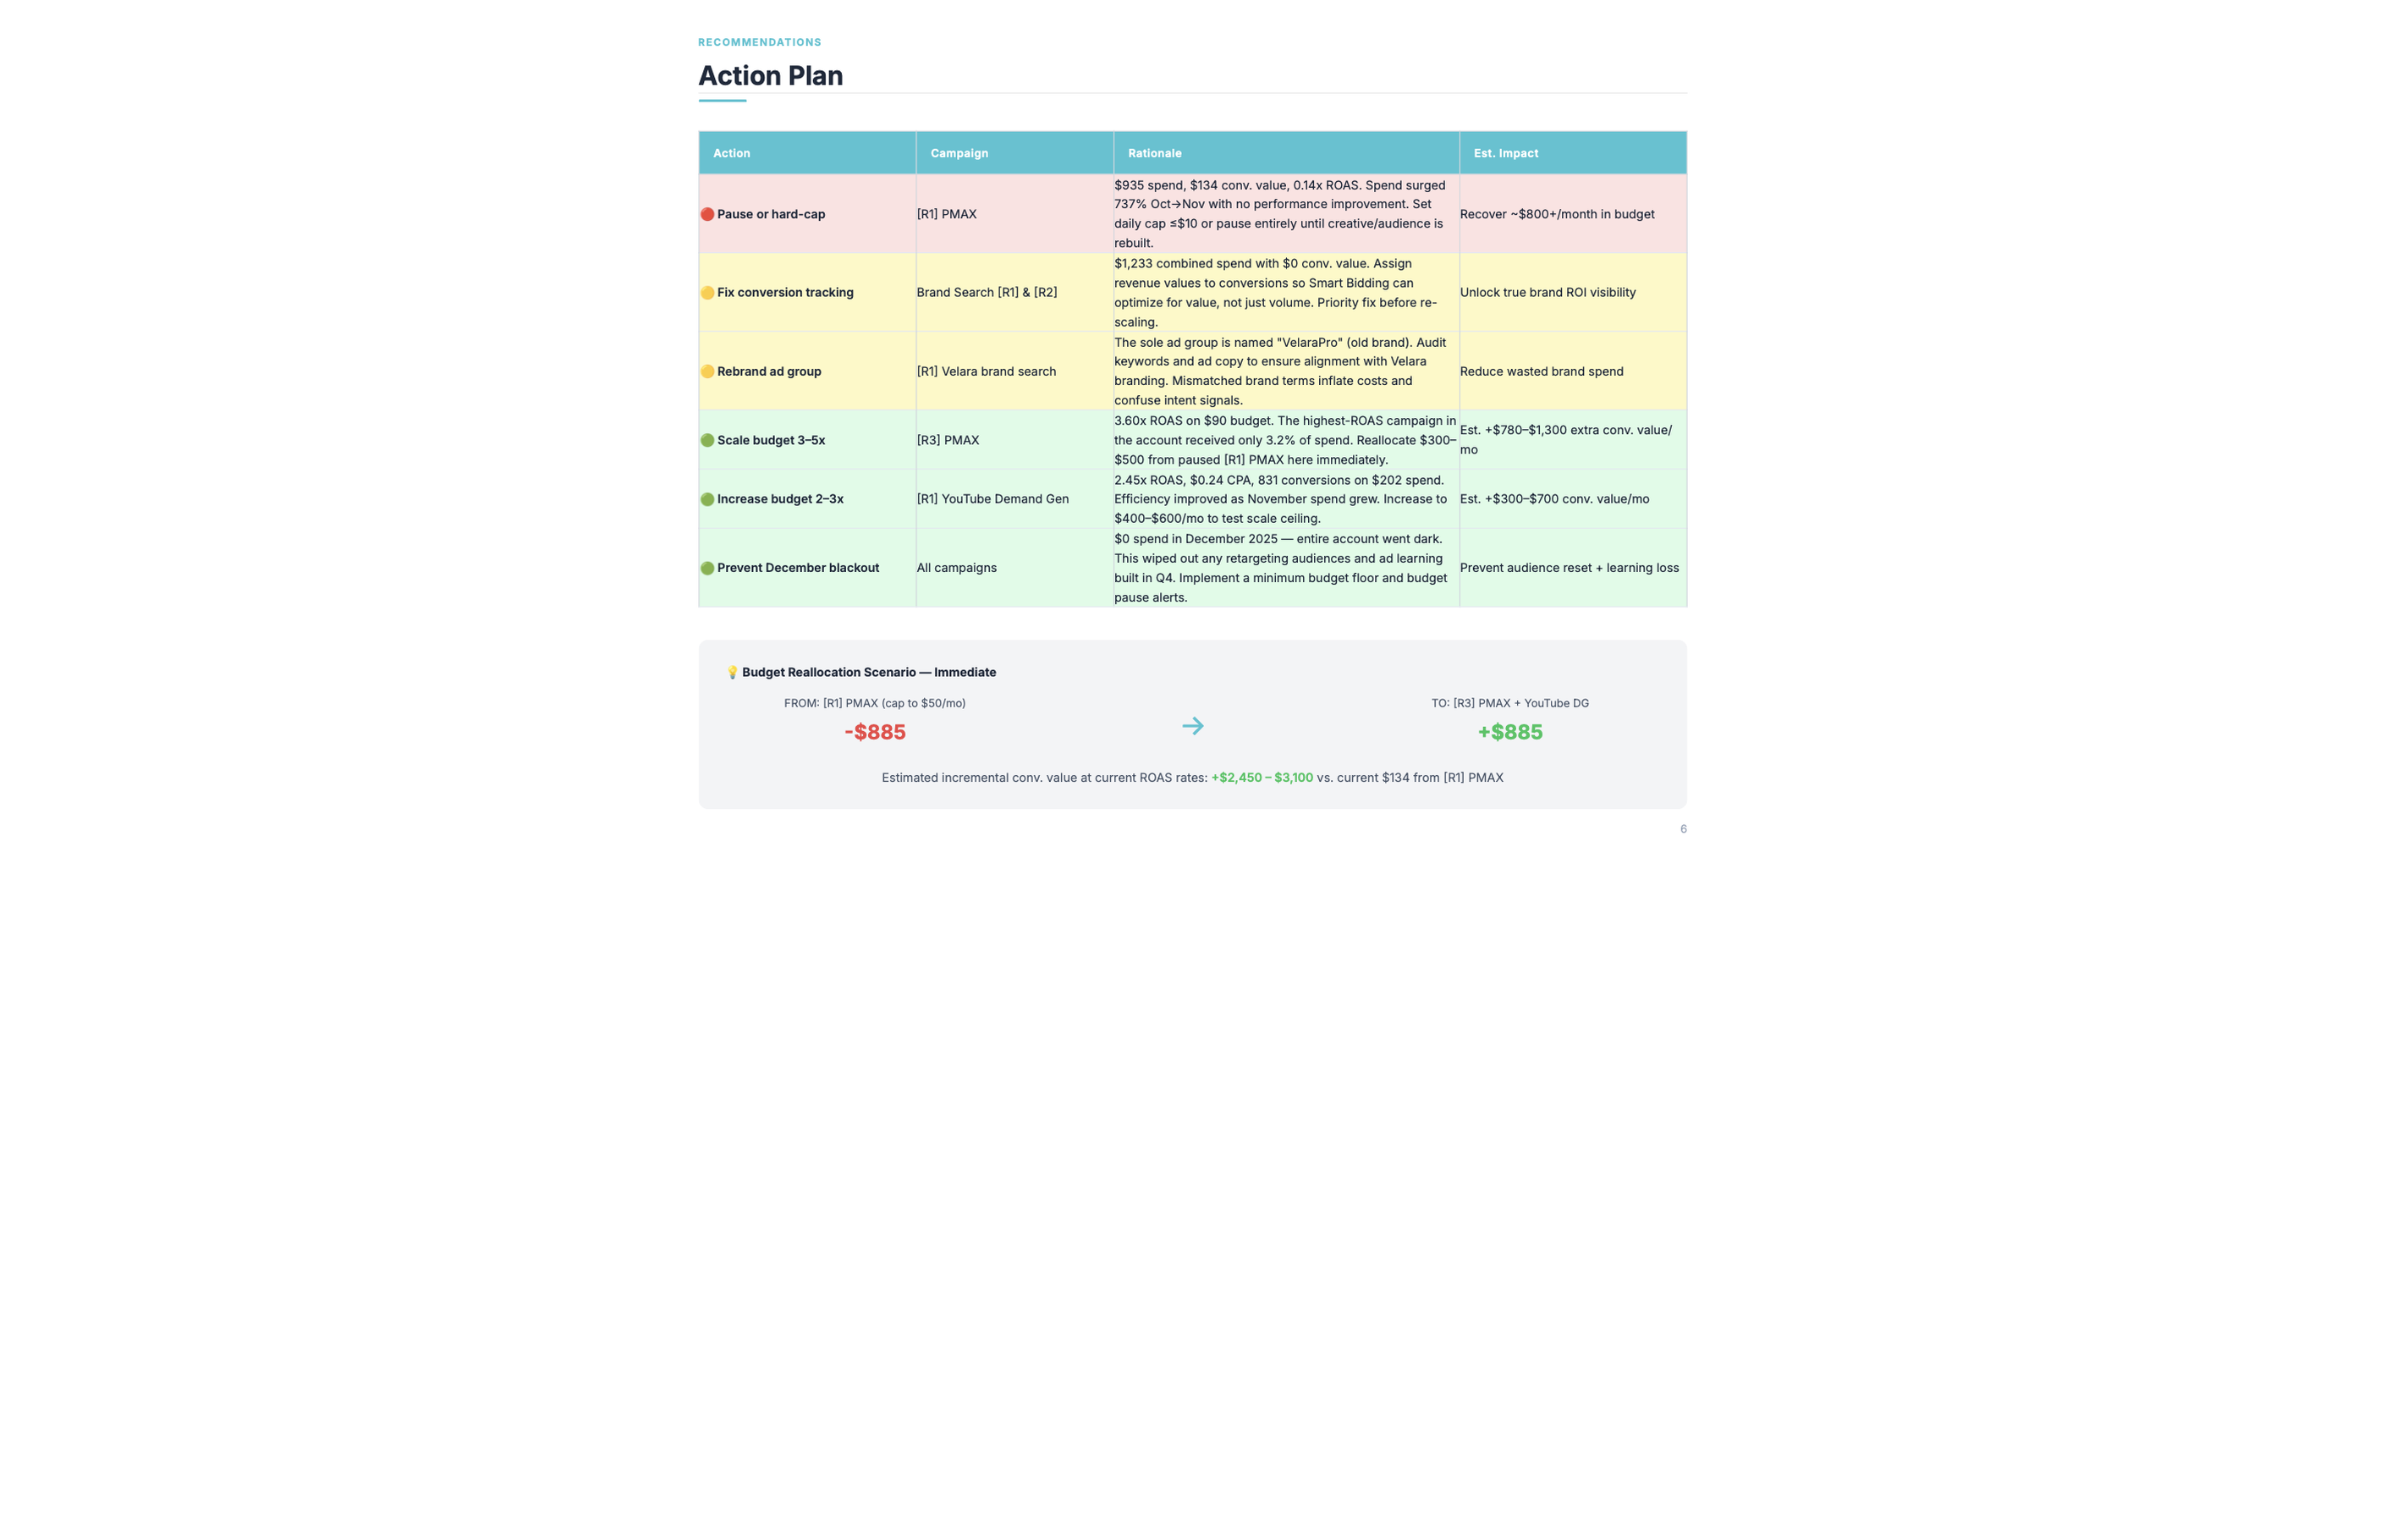
The campaign scorecard ranks every campaign by efficiency, showing spend share versus conversion share side by side. It flags campaigns where budget is disproportionate to results, calls out broken or missing conversion tracking that may be hiding real costs, and ends with an action plan table that specifies what to cut, consolidate, or scale across the account.
The efficiency ranking orders campaigns from best to worst based on the ratio of conversions delivered to budget consumed. A campaign with high spend share and low conversion share sits at the bottom. A campaign with low spend share and high conversion share sits at the top, and the plan section calls out scaling it.
Budget-to-result charts visualize the gap between the two columns at a glance. For clients who respond better to visual comparisons than tables, the chart section makes the imbalance obvious without explanation. The action plan table then translates what the charts show into specific next steps, campaign by campaign.
Does the analysis identify wasted ad spend specifically?
Yes. The analysis finds where budget is going relative to where results are coming from, then breaks the waste into two categories: campaigns delivering no meaningful results (flagged for pause or restructure) and campaigns leaking budget to targeting inefficiency (flagged for negative keywords, ad group splits, or match type changes). Both categories appear in the same report.
Calling out both types together gives the team a clear priority order. Quick fixes like adding negative keywords can often be addressed the same week, while structural changes to underperforming campaigns take longer to plan and test. Having both lists in a single document lets the team move on fast wins immediately while planning the larger work.
The action plan table in the PDF specifies what to cut, what to consolidate, and what to scale, with the spend and conversion numbers behind each call. Every recommendation connects to data the client can see in the same document.
What data does Juma need to run the analysis?
Juma needs campaign performance data for the chosen time period. The simplest option is connecting your Google Ads account - the integration pulls live campaign data, conversion tracking, and search terms reports automatically. If you prefer not to connect, upload a standard Google Ads CSV export and the analysis runs from that file instead. The output is the same either way.
For live data, the Google Ads integration pulls campaign performance, budget pacing, conversion data, and search terms reports directly. There is no manual export step, and the data reflects the state of the account at the time the Flow runs. This is the recommended setup for teams running monthly audits across multiple client accounts.
For uploaded exports, the standard Google Ads campaign performance report in CSV format works. Download it from Google Ads, upload it to Juma in the chat or attach it to the project, and run the same prompt. The only difference is that the data reflects whatever date range the export covers.
How does this compare to Google's built-in reporting?
Google's built-in reporting shows what happened to each campaign individually. This Flow puts spend share and result share next to each other across every campaign, builds a prioritized action plan, and flags conversion tracking issues that cause native reporting to undercount results. Those three things together are what Google Ads reporting does not produce on its own.
Google Ads surfaces performance metrics campaign by campaign but does not compare budget allocation across the full account in a single view. Seeing that Campaign A spent $4,000 and Campaign B spent $800 tells you nothing on its own. Seeing that Campaign A produced 12 conversions at $333 CPA while Campaign B produced 18 conversions at $44 CPA changes the conversation entirely.
The Flow also surfaces conversion tracking gaps that native reporting cannot detect. An account with broken tracking on one campaign may show a weak performer where the campaign is actually converting at a normal rate. The audit calls this out before the team makes budget decisions based on incomplete data.