Analytics & Reporting
Advertising
Google Ads
Google Ads
Meta Ads
Meta Logo
Meta Ads
Google Ads
Meta Ads
Meta Logo

Turn data into a presentation with AI: an executive summary, charts & reallocation recommendations

Paste a dataset into chat and Juma turns it into a client-ready presentation: charts that tell the story, an executive summary, and reallocation recommendations.

Paste a table into chat, attach a spreadsheet, or hand Juma a campaign export, and it reads the numbers, works out the metrics that matter (return on ad spend, cost per acquisition, and share of spend), and builds the deck. The presentation opens with an executive snapshot, tells the story with a chart on every slide, and closes with the findings and one clear recommendation for what to do next. More than 400 marketing teams use Juma to turn raw exports into finished client decks, and this is the flow that saves an afternoon of copy-pasting numbers into slides. You get a polished PDF to present and an editable PPTX to adjust, so the deck is ready either way.

1

Turn a paid-media dataset into a client-ready deck

Thank you! Your submission has been received!
Oops! Something went wrong while submitting the form.
Try This Flow

Example Flow result

Hide details
  • Paste the numbers straight into chat. A small table like the sample runs with zero uploads. Copy a block of rows from a spreadsheet and Juma reads it directly, no file needed.
  • Name the audience and the takeaway. "This is for the client's CMO, lead with efficiency" points the deck at one message instead of charting everything with equal weight.
  • Let Juma do the math. Give it raw spend, conversions, and revenue and it works out ROAS, CPA, and share of spend for you. No need to pre-calculate columns before you paste.
  • Ask for the format you need up front. Say "PDF and editable PPTX" and you get both: one to present as is, one to tweak before it goes to the client.
  • Point at the story, not just the charts. "Show me which channel is underfunded" gets a narrative and a recommendation. "Make charts" gets charts. The prompt sets the depth.
  • Add the client's brand to a project. With brand colors, logo, and a template saved once, every deck comes out on brand from the first draft instead of in default styling.
2

How do you turn a raw spreadsheet export into a deck?

Real exports are messier than a clean sample: extra columns, blank rows, currency symbols, a date range in the header. Hand Juma the raw file anyway and it cleans it up, keeps the columns that matter, works out the metrics, and builds the same client-ready deck. This is the step that skips the manual "prep the data first" work most teams do before they even open a slide. Point Juma at a Google Ads or Meta Ads export straight from the platform and the deck comes back formatted, charted, and ready to review.

Prompt
Copy

Here's our client's raw Google Ads export with all its extra columns. Clean it up, work out the metrics that matter, and build the same client-ready deck from it.

Try This Flow
3

How do you get the chart that tells the story?

A chart per slide is table stakes. The story is which chart leads. Ask Juma to put the one chart that carries the narrative on the opening data slide: spend share against ROAS, so an underfunded winner or an overfunded laggard is obvious at a glance. It picks the right shape for each cut (a pie for spend mix, bars for a revenue or ROAS leaderboard, a clean comparison for CPA) and leads with the one that changes the conversation. The team gets a deck that argues a point, not a folder of charts the client has to interpret alone.

Prompt
Copy

Rebuild the deck so the lead chart shows ROAS against share of budget on one slide, and put the channel with the highest ROAS and smallest budget front and center.

Try This Flow
4

How do you add recommendations, not just charts?

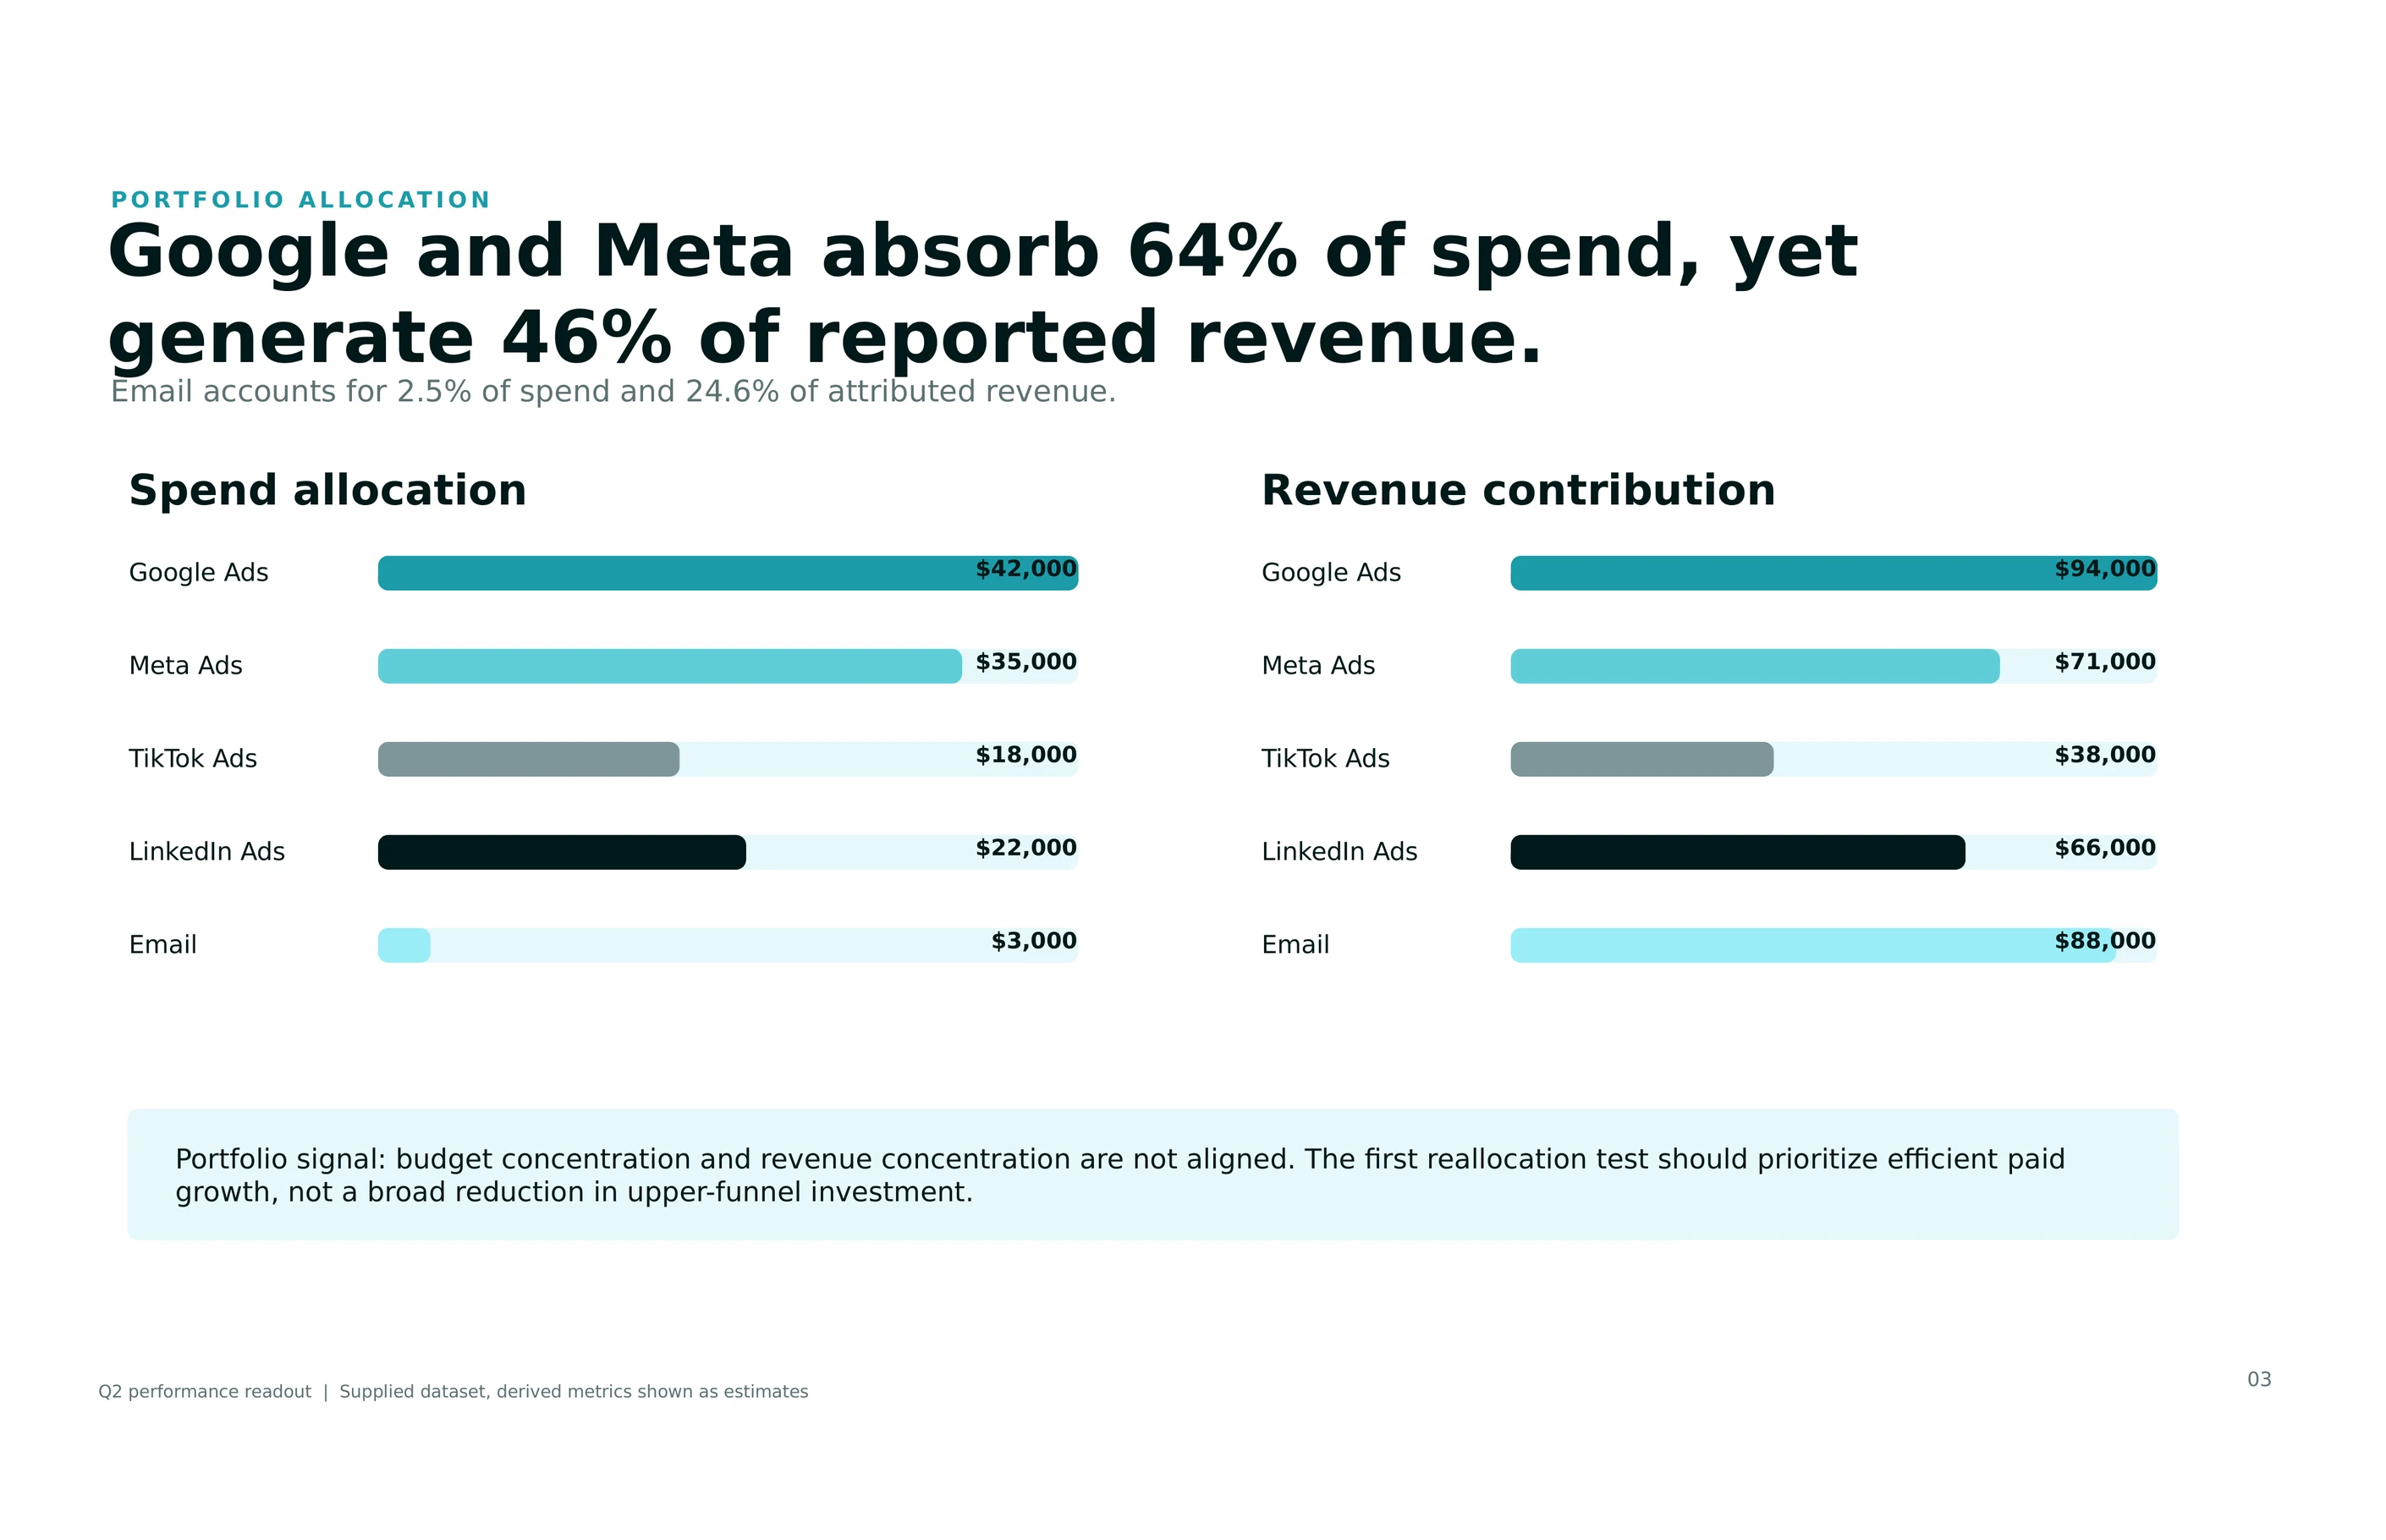
Charts show what happened. A client pays for what to do next. Ask Juma to add a findings-and-recommendations slide that names the two or three things the data shows and one concrete move for next quarter, with the numbers behind it. On the sample dataset, that meant flagging Email as the highest-ROAS channel sitting on the smallest budget, then recommending a shift of spend toward it and away from the lowest-return channel. Every recommendation ties back to a figure on an earlier slide, so the account lead can defend it in the room without pulling up a spreadsheet.

Prompt
Copy

Add a findings and recommendations slide: name the three things the data shows and one budget reallocation we should make next quarter, with the numbers behind each call.

Try This Flow
5

How do you keep the deck on brand?

A data deck still has to look like the client's team made it. With the client's colors, logo, fonts, and a slide template saved in their Juma Project, the deck comes out on brand from the first draft. Juma applies the Brand Voice to the headlines and the visual identity to the slides, so nothing arrives in default styling that someone has to reformat by hand. For agencies, this is the difference between one deck template reused across every monthly report and a fresh cleanup job each time. Match an existing master deck and the new numbers drop into a layout the client already approved.

Prompt
Copy

Rebuild the deck in our client's brand: their colors, logo, and slide template, and rewrite the headlines in their voice.

Try This Flow

Set up your client project: brand, reporting format, and performance history

A Juma Project is a shared space where the team keeps everything Juma needs to know about a client. Build one project per client and every presentation pulls from the same context, so the deck reads and looks the same whether the account lead runs it or someone covering for them does. Add these items once and the flow stops asking the same setup questions every month.

What to add

Brand Kit & Voice Guide

The client's colors, logo, fonts, and how they write: tone, level of detail, words to avoid. With this in the project, every deck and every headline comes out on brand from the first draft instead of in default styling.

Reporting Template & Format

The slide structure the client expects: which sections, in what order, and any master deck to match. This gives Juma a layout the client already signed off on, so the numbers drop into a familiar shape every time.

Performance Benchmarks

Last quarter's ROAS, CPA, and revenue by channel, plus the targets the client set. When this exists, the deck compares current results against the client's own trajectory and goals, not just against the numbers in the file.

Channel & Audience Context

Which channels matter to this client, who the audience is, and any constraints on where budget can move. This keeps the recommendations grounded in what the client can actually act on, not just what the math suggests.

Guide Juma with project info

Add a short description to each knowledge item in the project's info field so Juma knows what each file is and when to use it. For example:

  • Brand Kit & Voice Guide: "The client's colors, logo, and writing style. Apply to every slide and headline."
  • Reporting Template & Format: "The deck structure the client expects. Follow this layout every time."
  • Performance Benchmarks: "Last quarter's ROAS and CPA by channel, plus targets. Compare current results against these."
  • Channel & Audience Context: "Which channels matter and where budget can move. Use to ground the recommendations."
Juma Logo
Hand Juma the data, get the deck back

Frequently Asked Questions

How much time does this Flow save compared to building the deck by hand?

Building a client-ready data deck by hand takes two to four hours: cleaning the export, calculating ROAS and CPA, choosing charts, laying out slides, and writing the story. Juma reads the numbers and returns a formatted PDF and editable PPTX in minutes. Strategy, taste, and judgment stay human, and human review sits on every output.

For an agency building a monthly deck for every client, the saving compounds. A team running ten client decks a month recovers most of a working week, and because Juma has unlimited seats, the whole team runs the same flow instead of routing every deck through one analyst. The output stays consistent no matter who runs it, because the structure and the math are the same every time.

What's in the presentation Juma builds?

The deck runs about eight slides: a cover with a KPI preview, an executive snapshot with the blended ROAS, a spend breakdown, revenue by channel, a ROAS leaderboard, CPA by channel, a findings-and-recommendations slide, and a next-step timeline. Every data slide carries a chart, and it ships as a PDF and an editable PPTX.

Juma picks the chart type that fits each cut: a pie for the spend mix, bars for a revenue or ROAS leaderboard, a clean comparison for CPA. Because the PPTX is fully editable, the team can adjust a headline, drop a slide, or restyle a chart before it goes to the client, without rebuilding anything.

The findings slide is what separates this from a chart dump. It names what the data shows in plain language and points to one move worth making, with the numbers from the earlier slides behind it.

What data can I give Juma to build the deck?

Anything with the numbers in it. Paste a small table straight into chat, attach an Excel or CSV spreadsheet, or hand Juma a raw export from Google Ads or Meta Ads. It reads whichever you give it, works out the metrics, and builds the same deck. The inline paste is the fastest, with no upload at all.

Messy exports are fine. Juma handles extra columns, blank rows, currency symbols, and header text, keeps the fields that matter, and works out ROAS, CPA, and share of spend from raw spend, conversions, and revenue. There's no need to prep the data into clean columns before you hand it over.

Can Juma find the insight, or does it just chart the numbers?

It finds the insight. On the sample dataset, Juma flagged that Email returned close to 29x on the smallest budget in the mix while a bigger-spending channel returned barely 2x, then recommended shifting budget toward the underfunded winner. It reasons about the numbers, it doesn't only plot them.

Every recommendation ties back to a figure on an earlier slide, so the account lead can defend it in the room. And because strategy and judgment stay with the team, the recommendation is a starting point the account lead reviews and adjusts, not a decision made for them. Human review sits on every deck before it reaches the client.

Can I match the deck to our client's brand?

Yes. Save the client's colors, logo, fonts, and a slide template in their Juma Project, and the deck comes out on brand from the first draft. Juma applies the Brand Voice to the headlines and the visual identity to the slides, so the presentation looks like the client's team made it.

For agencies, this turns the monthly report into a repeatable job. The template and brand context live in the project, so each month's numbers drop into a layout the client already approved, and the deck stays consistent across every account the team runs.

Don't take our word for it

Ask AI about us

400+ marketing teams trust Juma. ChatGPT, Claude, and Perplexity know why. Ask them.

Ready when you are

What's on your plate today?

Start typing a task and Juma will figure out the rest.

Thank you! Your submission has been received!
Oops! Something went wrong while submitting the form.