Set up your client project: targets, brand, and past reports
A Juma Project is the shared space where the agency stores everything Juma needs to know about a client. Create one project per client, add context over time, and Juma uses what is relevant every time the team runs a flow. The more the team adds, the sharper every report gets.
What to add
Performance Targets
Target CPA, target ROAS, and budget caps by channel. With this loaded, the scorecard measures against the client's own goals, not just industry benchmarks. The action plan also recommends moves that protect the targets, not just abstract optimisations.
Client Brief
Who the client is, what they sell, who they target, and what is in scope for the engagement. This is the file that shapes the strategic framing of the recommendations. Without it, Juma reports on the data accurately but cannot anchor the recommendations in the client's actual business priorities.
Agency Brand & Visual Identity
The agency's logo, brand colours, and typography. Juma applies these to the cover, headers, and accent treatments of the report so the PDF looks like an agency deliverable, not a tool export. Add light and dark logo variants if the agency uses both.
Past Reports
Two or three of the agency's strongest past monthly reports as PDFs or HTML files. Juma picks up the structure, section order, and depth of detail the agency uses, so new reports look consistent with what the client already expects to receive.
Guide Juma with project info
Add a short description to each knowledge item in the project info field so Juma knows what each file contains and when to use it. For example:
- Performance Targets: "CPA, ROAS, and budget caps by channel. Score against these in every report."
- Client Brief: "Client business context and engagement scope. Use to frame the recommendations."
- Agency Brand & Visual Identity: "Agency logos, colours, and fonts. Apply to every report deliverable."
- Past Reports: "Two strong past monthly reports. Use as a structural reference for new ones."
Skip the Monday-morning screenshot routine
Frequently Asked Questions
How much time does this Flow save compared to building a client report manually?
Building a monthly client report manually involves logging into Google Ads, Meta Ads, and GA4 separately, exporting data, building charts in a deck, writing the narrative, and formatting the output to the agency's house style. Most agency teams spend half a day to a full day per client on this work, every month. This Flow compresses the work into a single chat session: Juma pulls all three data sources, builds the scorecards, layers in benchmark context, and renders the branded PDF.
The savings compound across a retainer book. An agency producing reports for ten clients a month saves a full team-week, every month. The deeper benefit is consistency: the same structure, depth, and format every cycle, regardless of who on the team triggers the Flow.
What does the final report include?
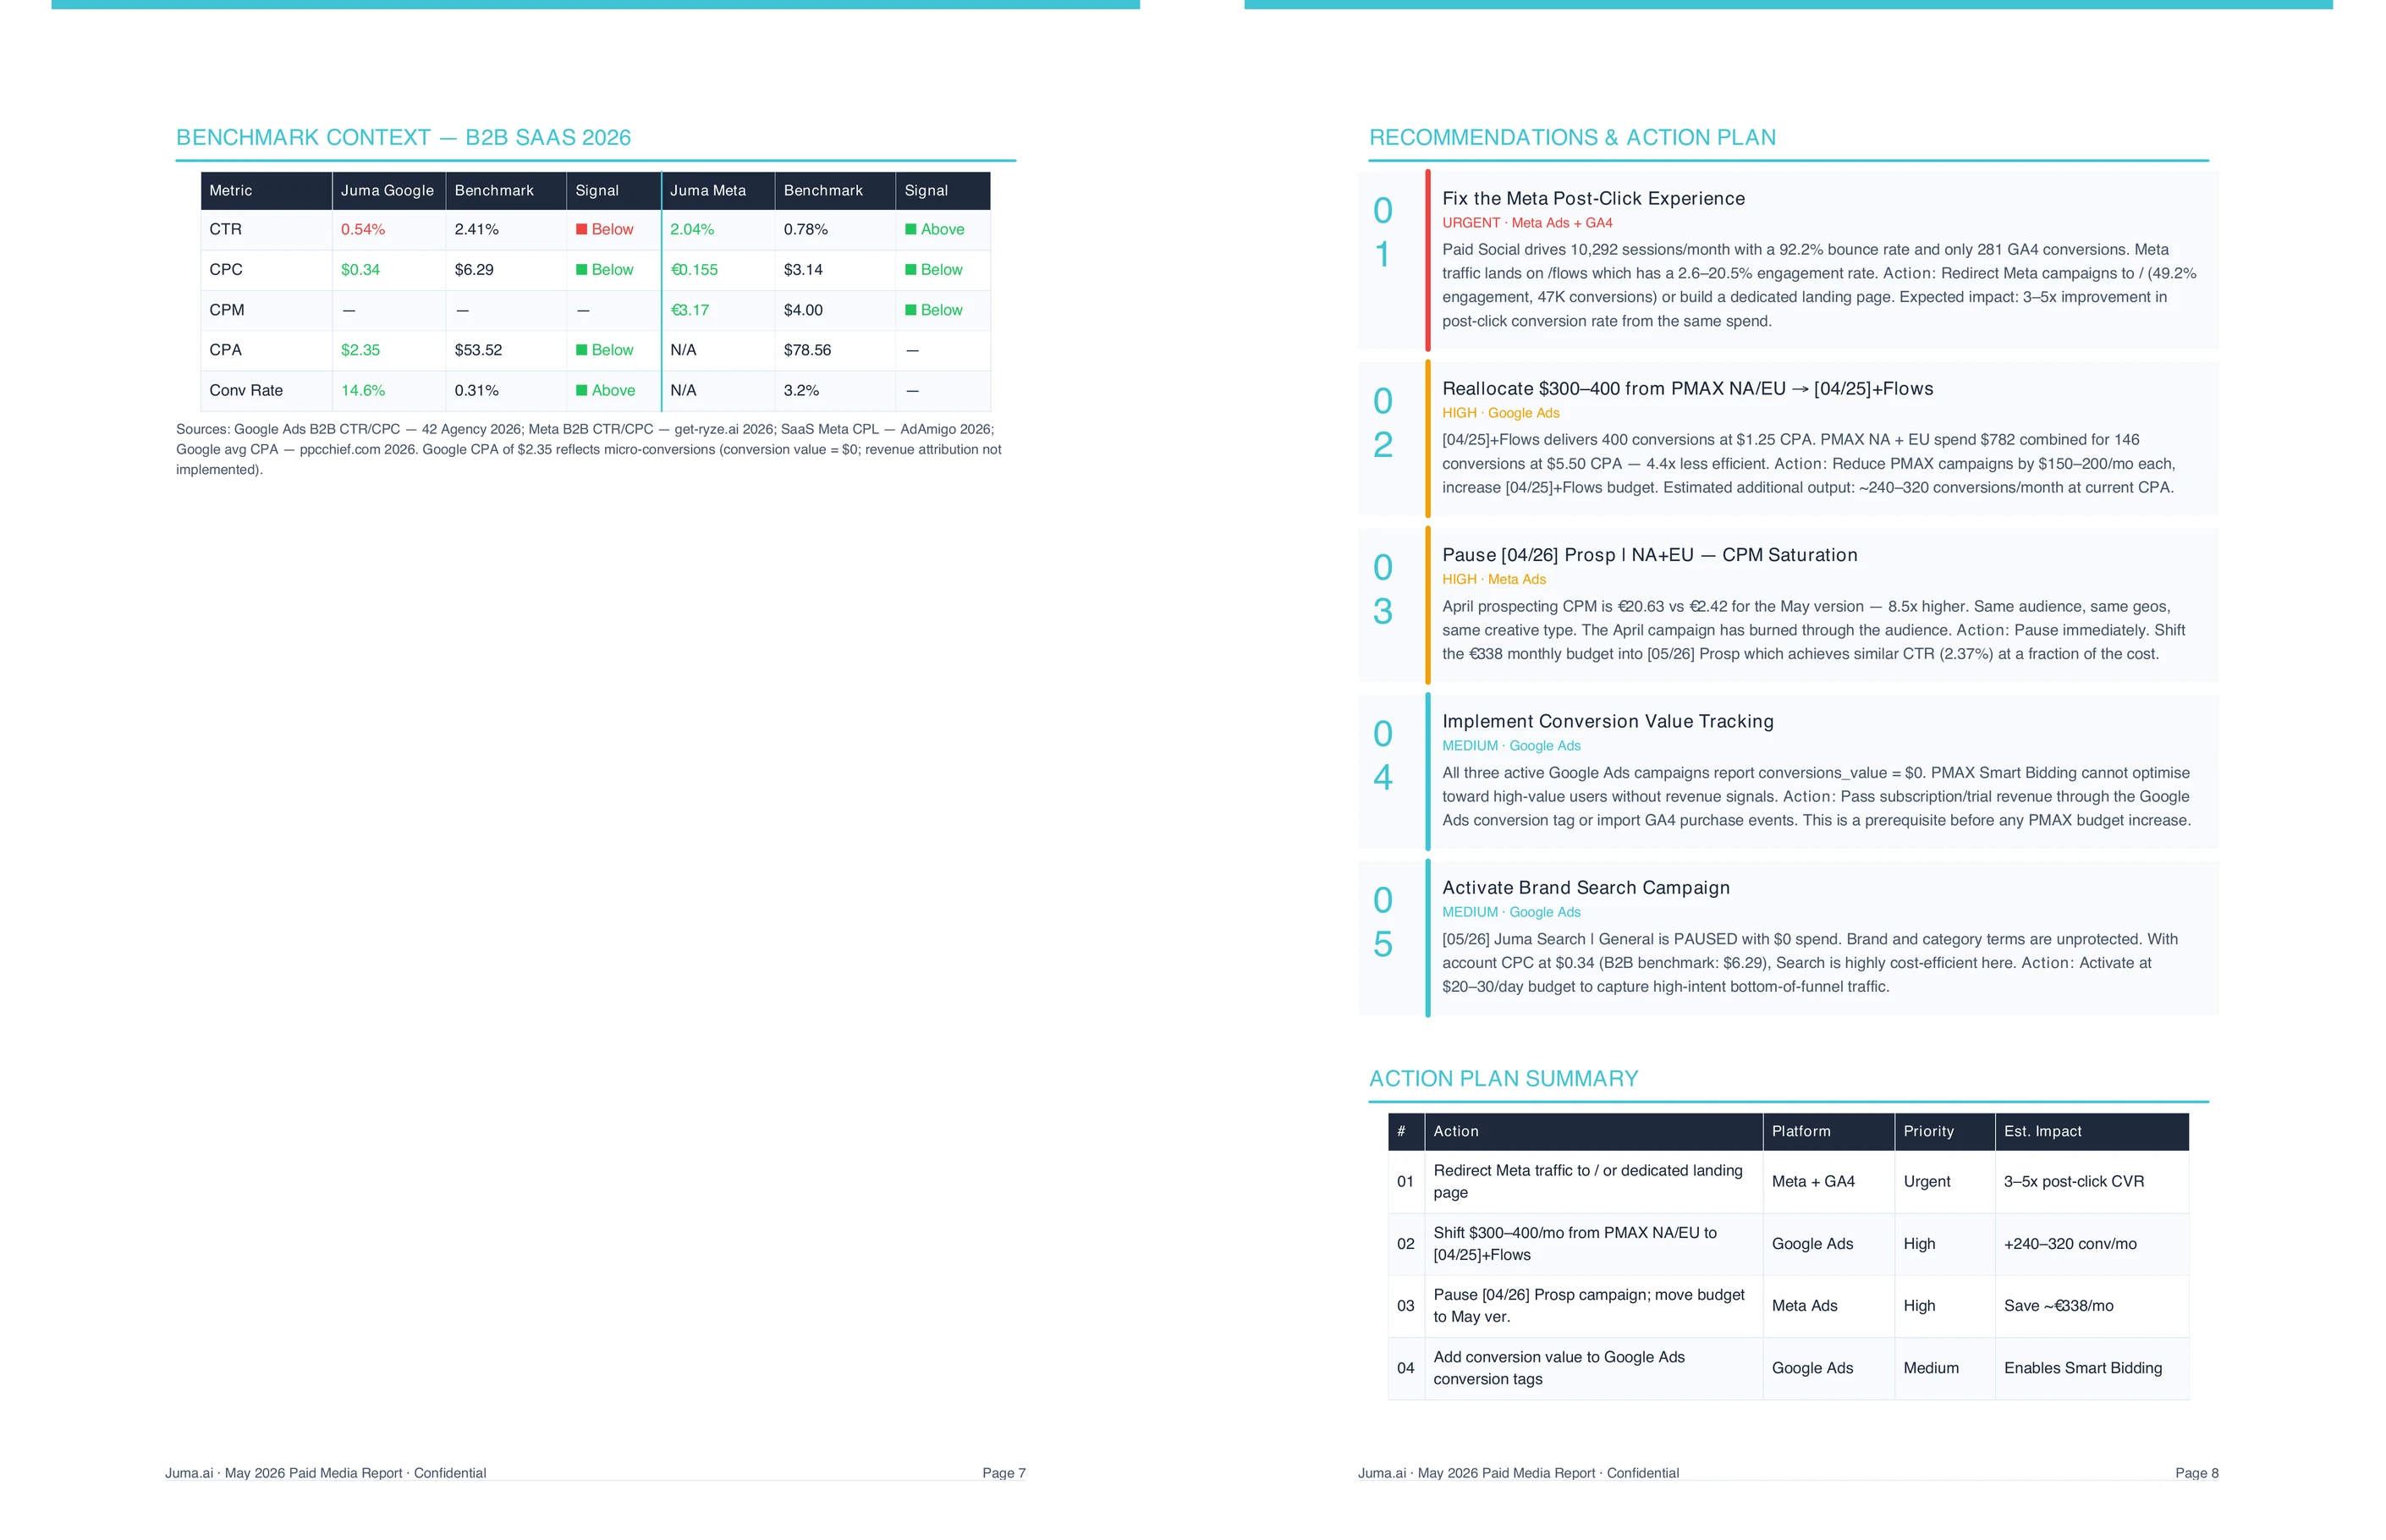
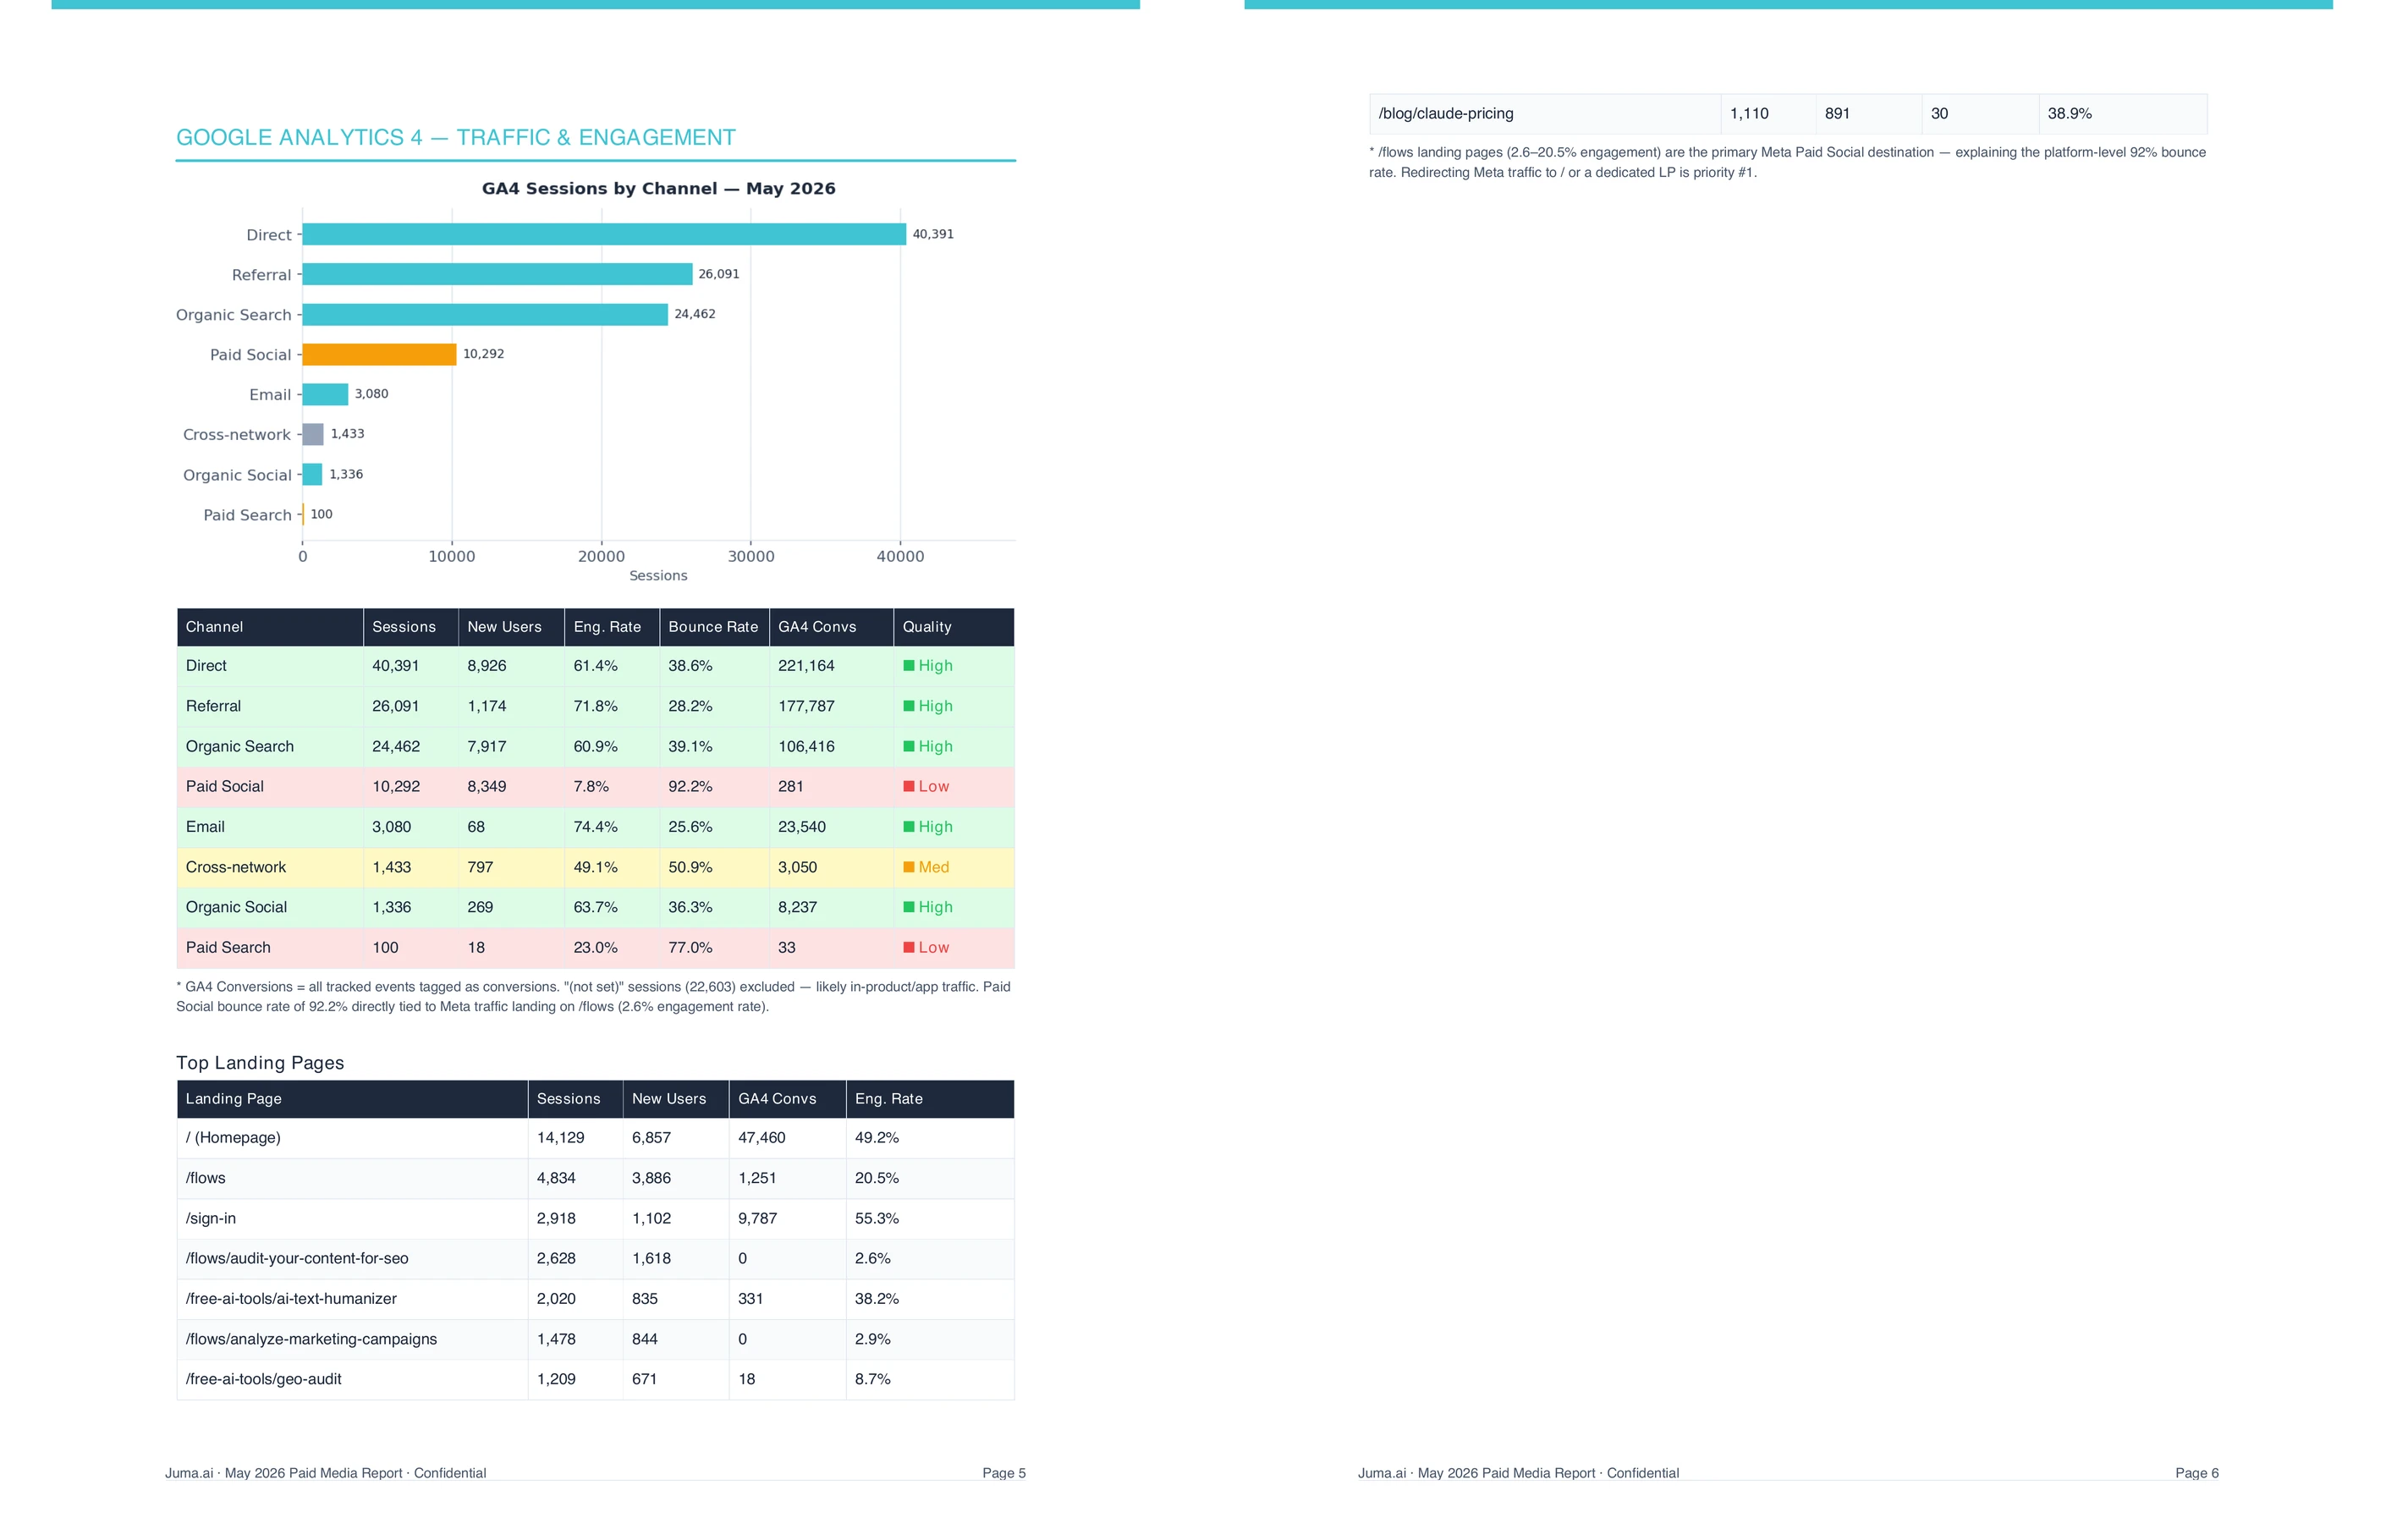
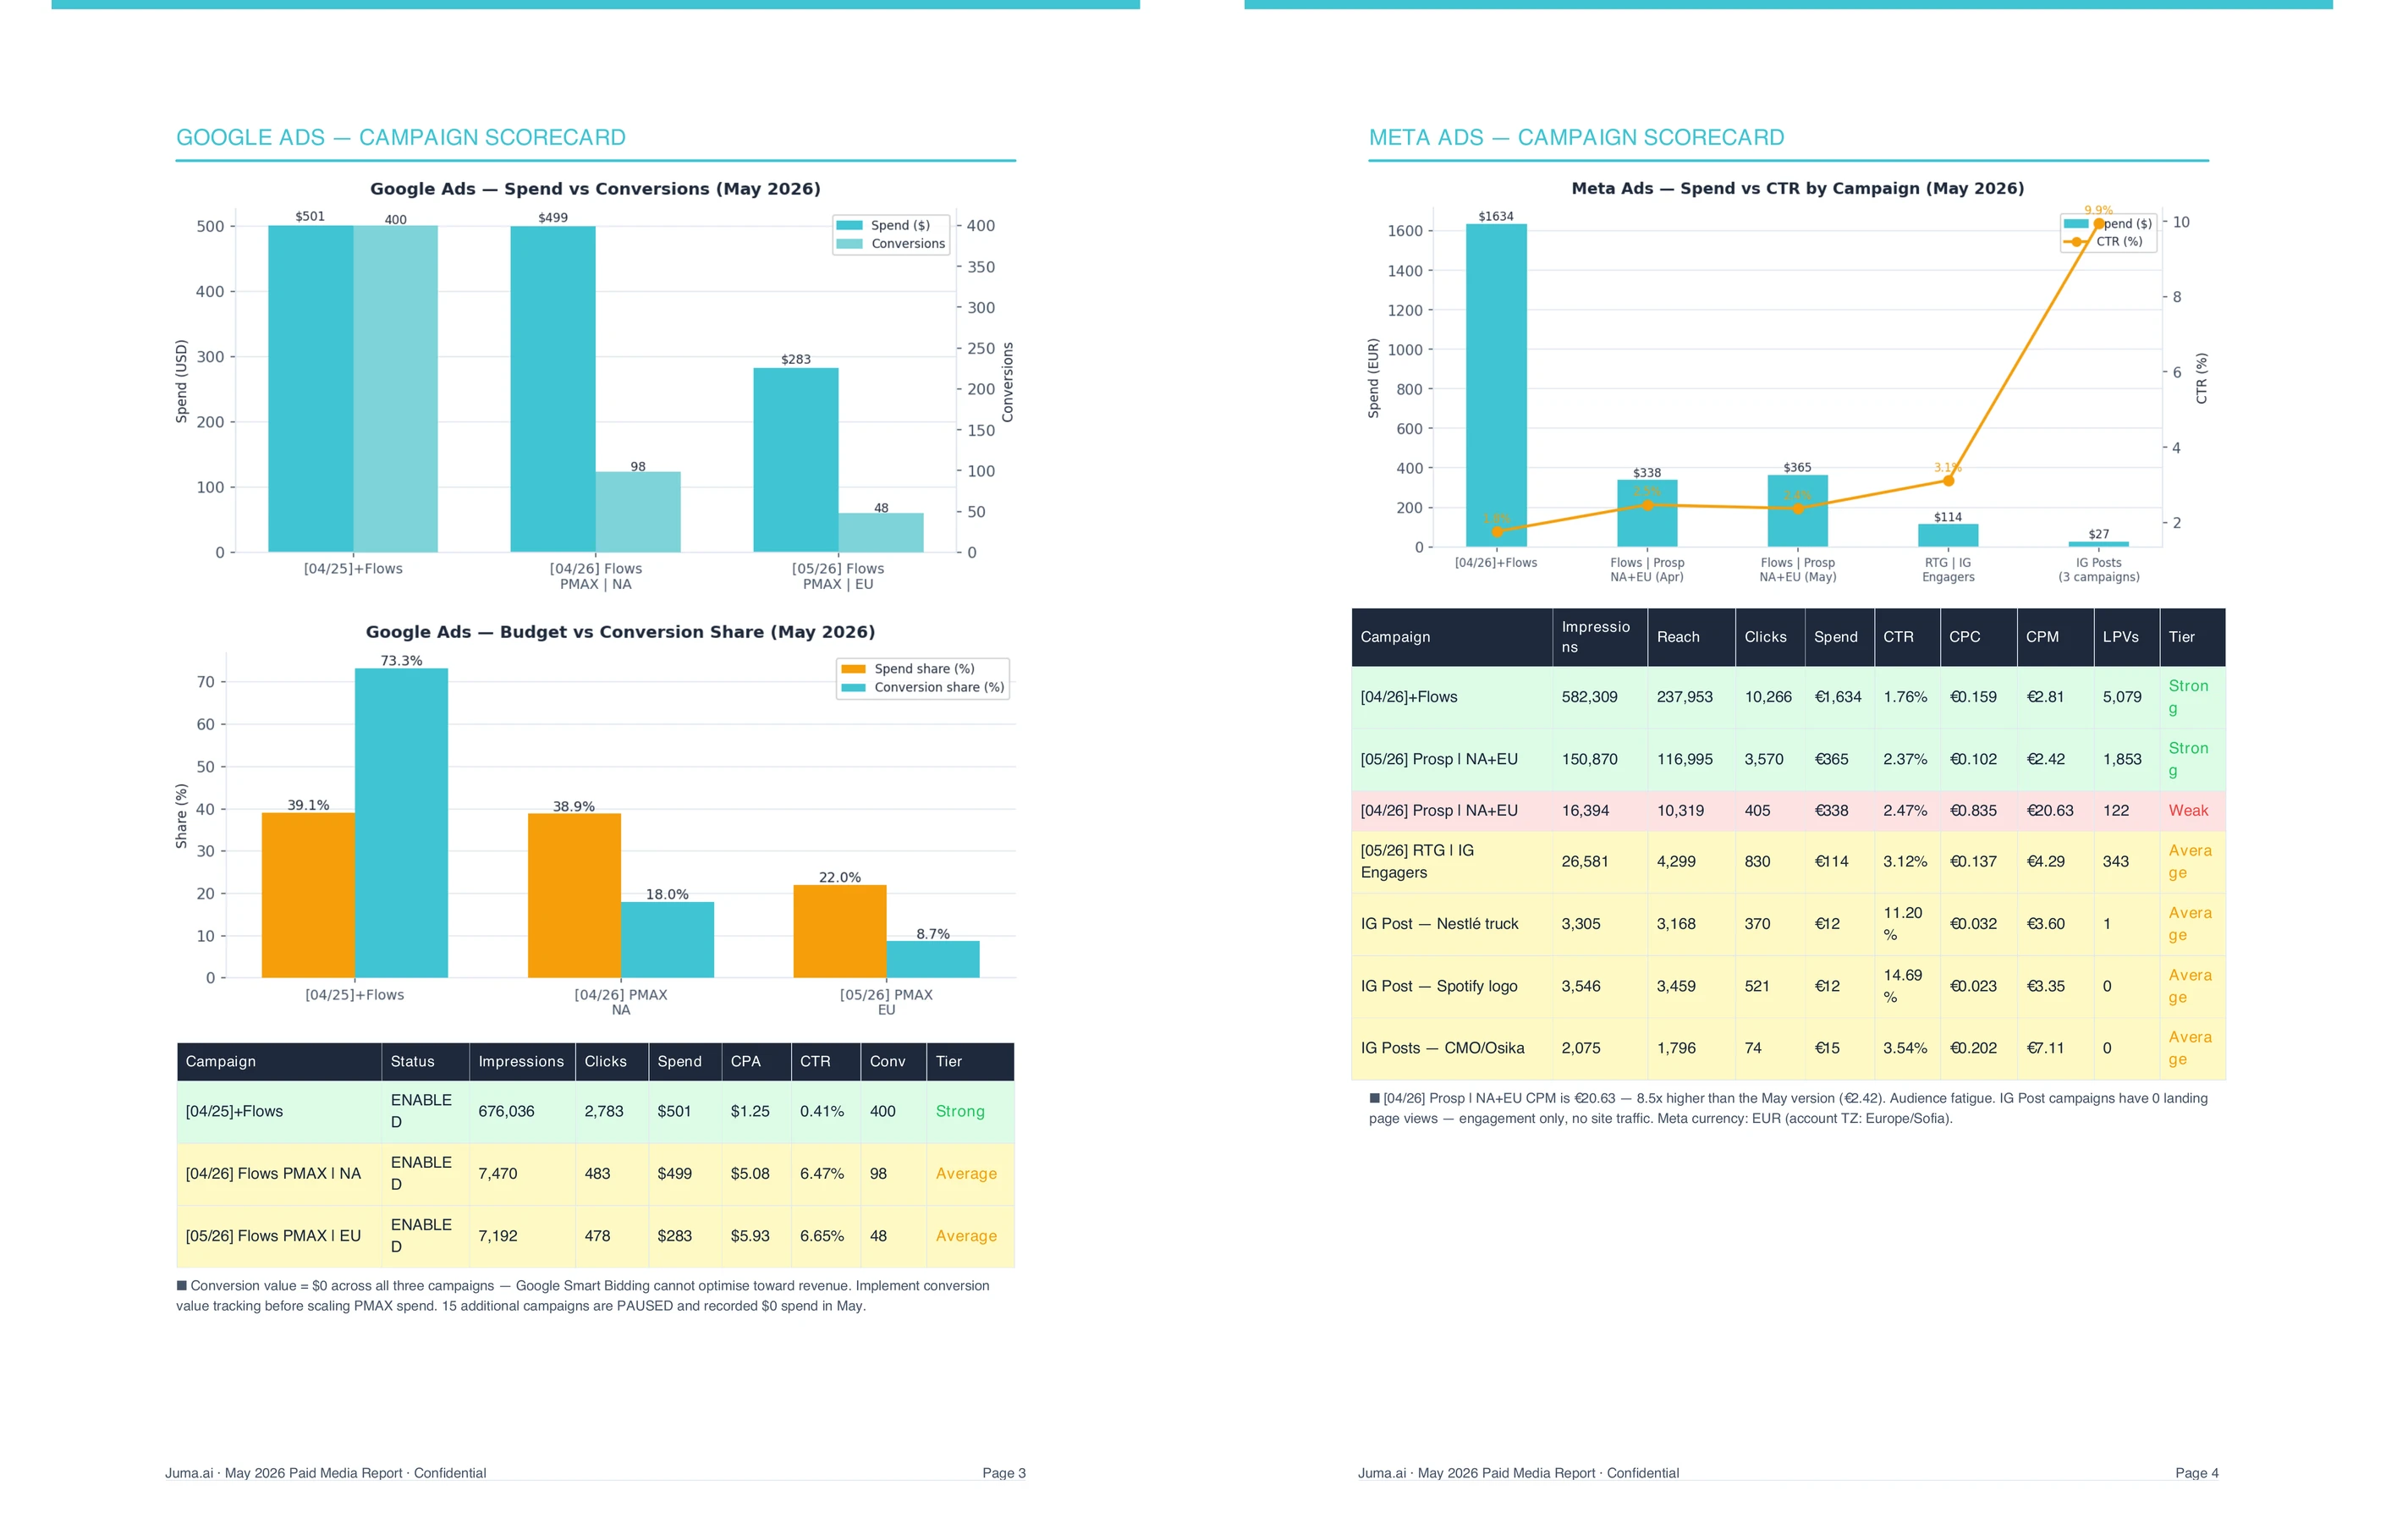
The default output is a branded PDF with seven sections: a cover with at-a-glance KPIs, an executive summary covering the month's three key themes, a Google Ads scorecard, a Meta Ads scorecard, a GA4 traffic and engagement section, an industry benchmark comparison, and a prioritised five-item action plan. Every chart is rendered from live data, every recommendation is grounded in specific numbers from the analysis.
The benchmark section compares the client's CTR, CPC, CPM, and CPA against the relevant industry vertical so the recommendations sit in context. The action plan ranks recommendations by impact and effort, and includes a specific dollar or percentage move per item where the data supports it.
Format is flexible. The default is a branded PDF, but the Flow asks at runtime whether to deliver an HTML file, an inline chat summary, or another format. Adding "build the slide deck" or "give me a one-page summary" to the original prompt skips the format question.
Does the report work for clients with only one or two ad platforms?
Yes. The Flow runs against whatever connected accounts the workspace has. A client running only Google Ads gets a Google Ads scorecard plus GA4 traffic and engagement, without empty placeholder sections for channels that are not in play. A client with Meta Ads only gets the equivalent.
The benchmark section adjusts to the channels in scope. The action plan stays focused on the channels with data. The report does not pretend to cover what it cannot measure.
What data does Juma need to run the report?
Juma needs Google Ads, Meta Ads, and GA4 connected to the workspace. The integrations pull live campaign data, conversion tracking, traffic, and landing page performance directly. There is no manual export step, and the data reflects the state of the accounts at the time the Flow runs.
For clients whose accounts cannot be connected directly, uploading a standard CSV export from each platform works as a fallback. The output is the same; the only difference is that the data reflects whatever date range the export covers. Live connections are recommended for teams running monthly reports across multiple client accounts.
How is this different from a Looker Studio dashboard?
A dashboard shows what happened. This Flow tells the story of what happened and recommends what to do about it. The same numbers a dashboard surfaces are in the report, but the report adds an executive summary, benchmark context, a prioritised action plan, and recommendations grounded in the data, rendered as a single branded PDF the agency can send.
Dashboards are useful when the client wants to log in and look themselves. Reports are useful when the client wants the agency to make sense of the data and propose what to do. Both stay in the toolbox. This Flow handles the second job, every month, without the half-day of formatting work.
Strategy, taste, and judgment stay human. Juma drafts the recommendations and renders the deliverable. The senior account lead reviews the call before it goes to the client.