Set up your client project: the stack inventory, the commercial targets, and last quarter's reporting
Run one project per client and the measurement plan stops reasoning from public documentation alone. Add what the team can see from the inside, and every plan built in that project inherits it. The difference shows up immediately in the measurability audit, because rows move out of needs instrumentation as soon as the plan knows what is already connected.
What to add
The stack inventory
Which analytics, CRM, billing, product analytics, and ad platforms are live, and which are actually connected to each other. This is the single item that changes the most statuses, because measurability is mostly a question of which joins already exist.
Commercial targets and definitions
The revenue or pipeline number marketing is accountable for, and how the business already defines a qualified lead, an opportunity, and a customer. Targets derived from these beat targets derived from a public funnel every time.
Last quarter's reporting
The decks and dashboards in use now, including the ones nobody reads. Seeing what is already reported is how the plan tells a genuine gap from a metric that exists under a different name.
Owners and review cadence
Who owns which channel, and when the numbers actually get looked at. A weekly metric with a quarterly owner is a metric nobody acts on, and the cadence column is where that shows up.
Guide Juma with project info
Each knowledge item takes a short description. One line is enough, and it tells Juma when to reach for that item instead of reasoning from the open web.
- Stack inventory: "The tools we have live and which ones are connected to each other, for deciding what is measurable today."
- Commercial targets: "The number marketing is accountable for, plus how we define a qualified lead, an opportunity, and a customer."
- Last quarter's reporting: "What we already report and to whom, so a gap is a real gap and not a renamed metric."
- Owners and cadence: "Who owns which channel and when the numbers get reviewed, for the owner and cadence columns."
Settle what marketing is measured on
Frequently Asked Questions
What does the measurement plan include?
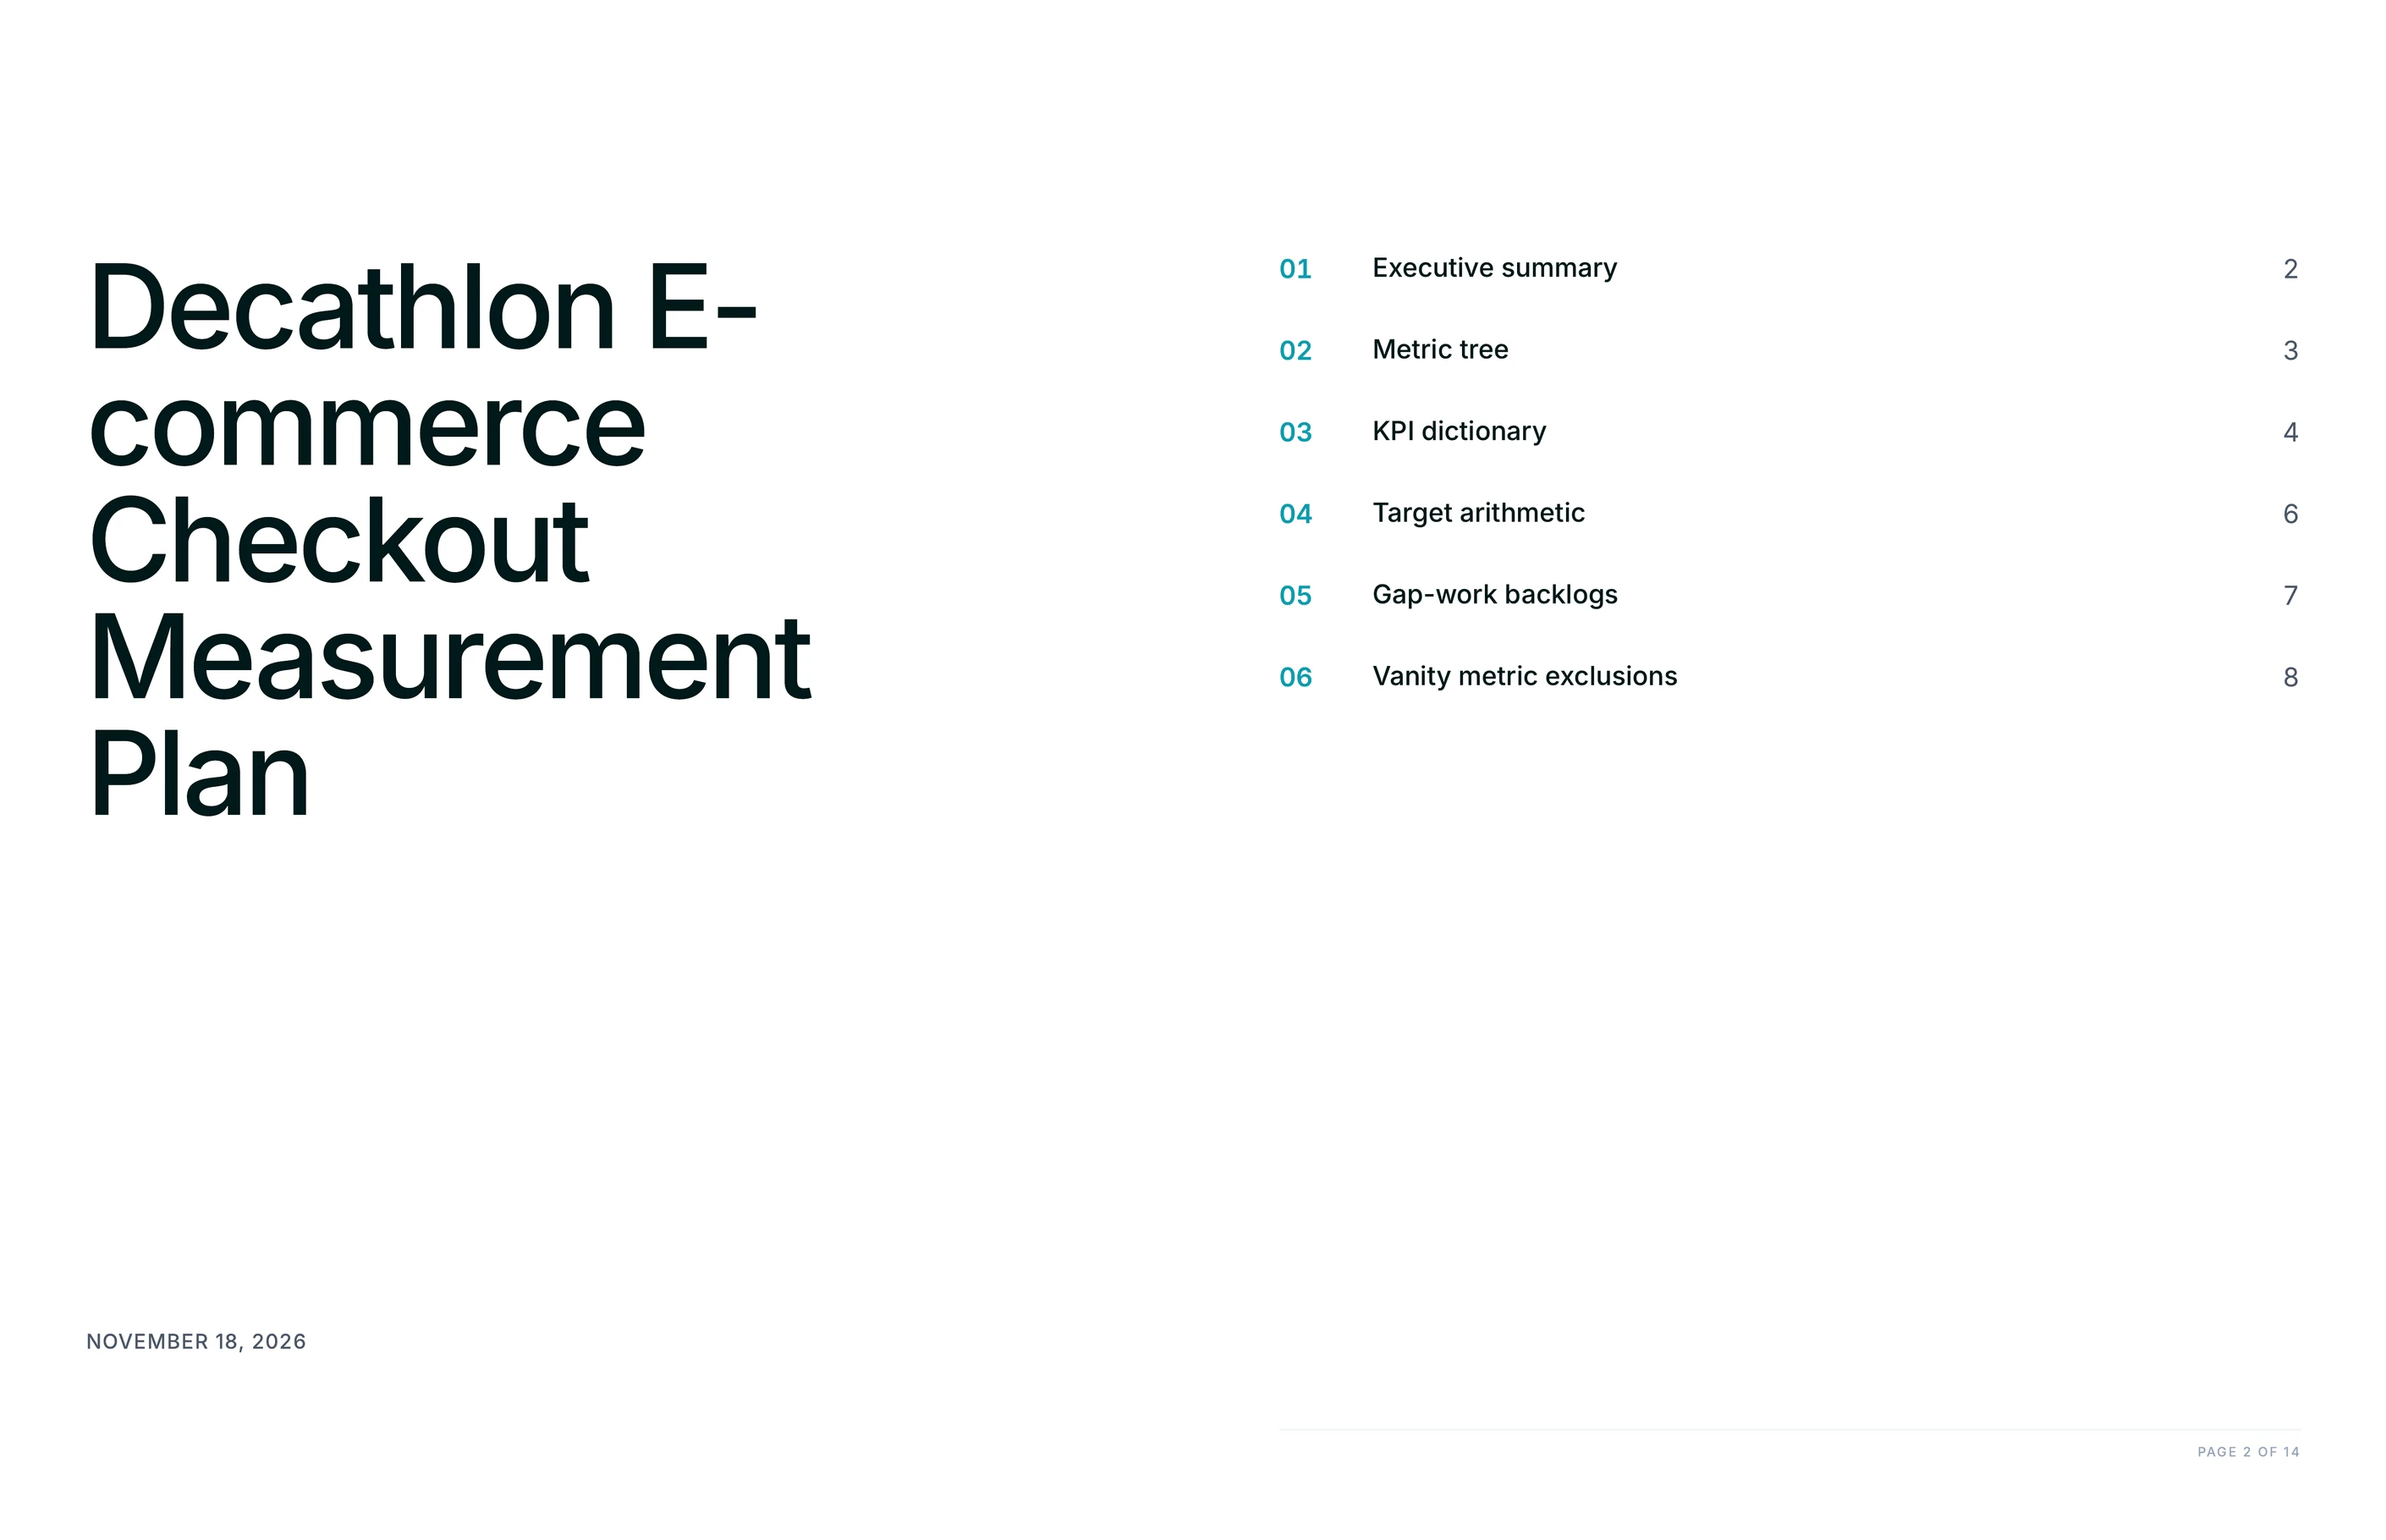
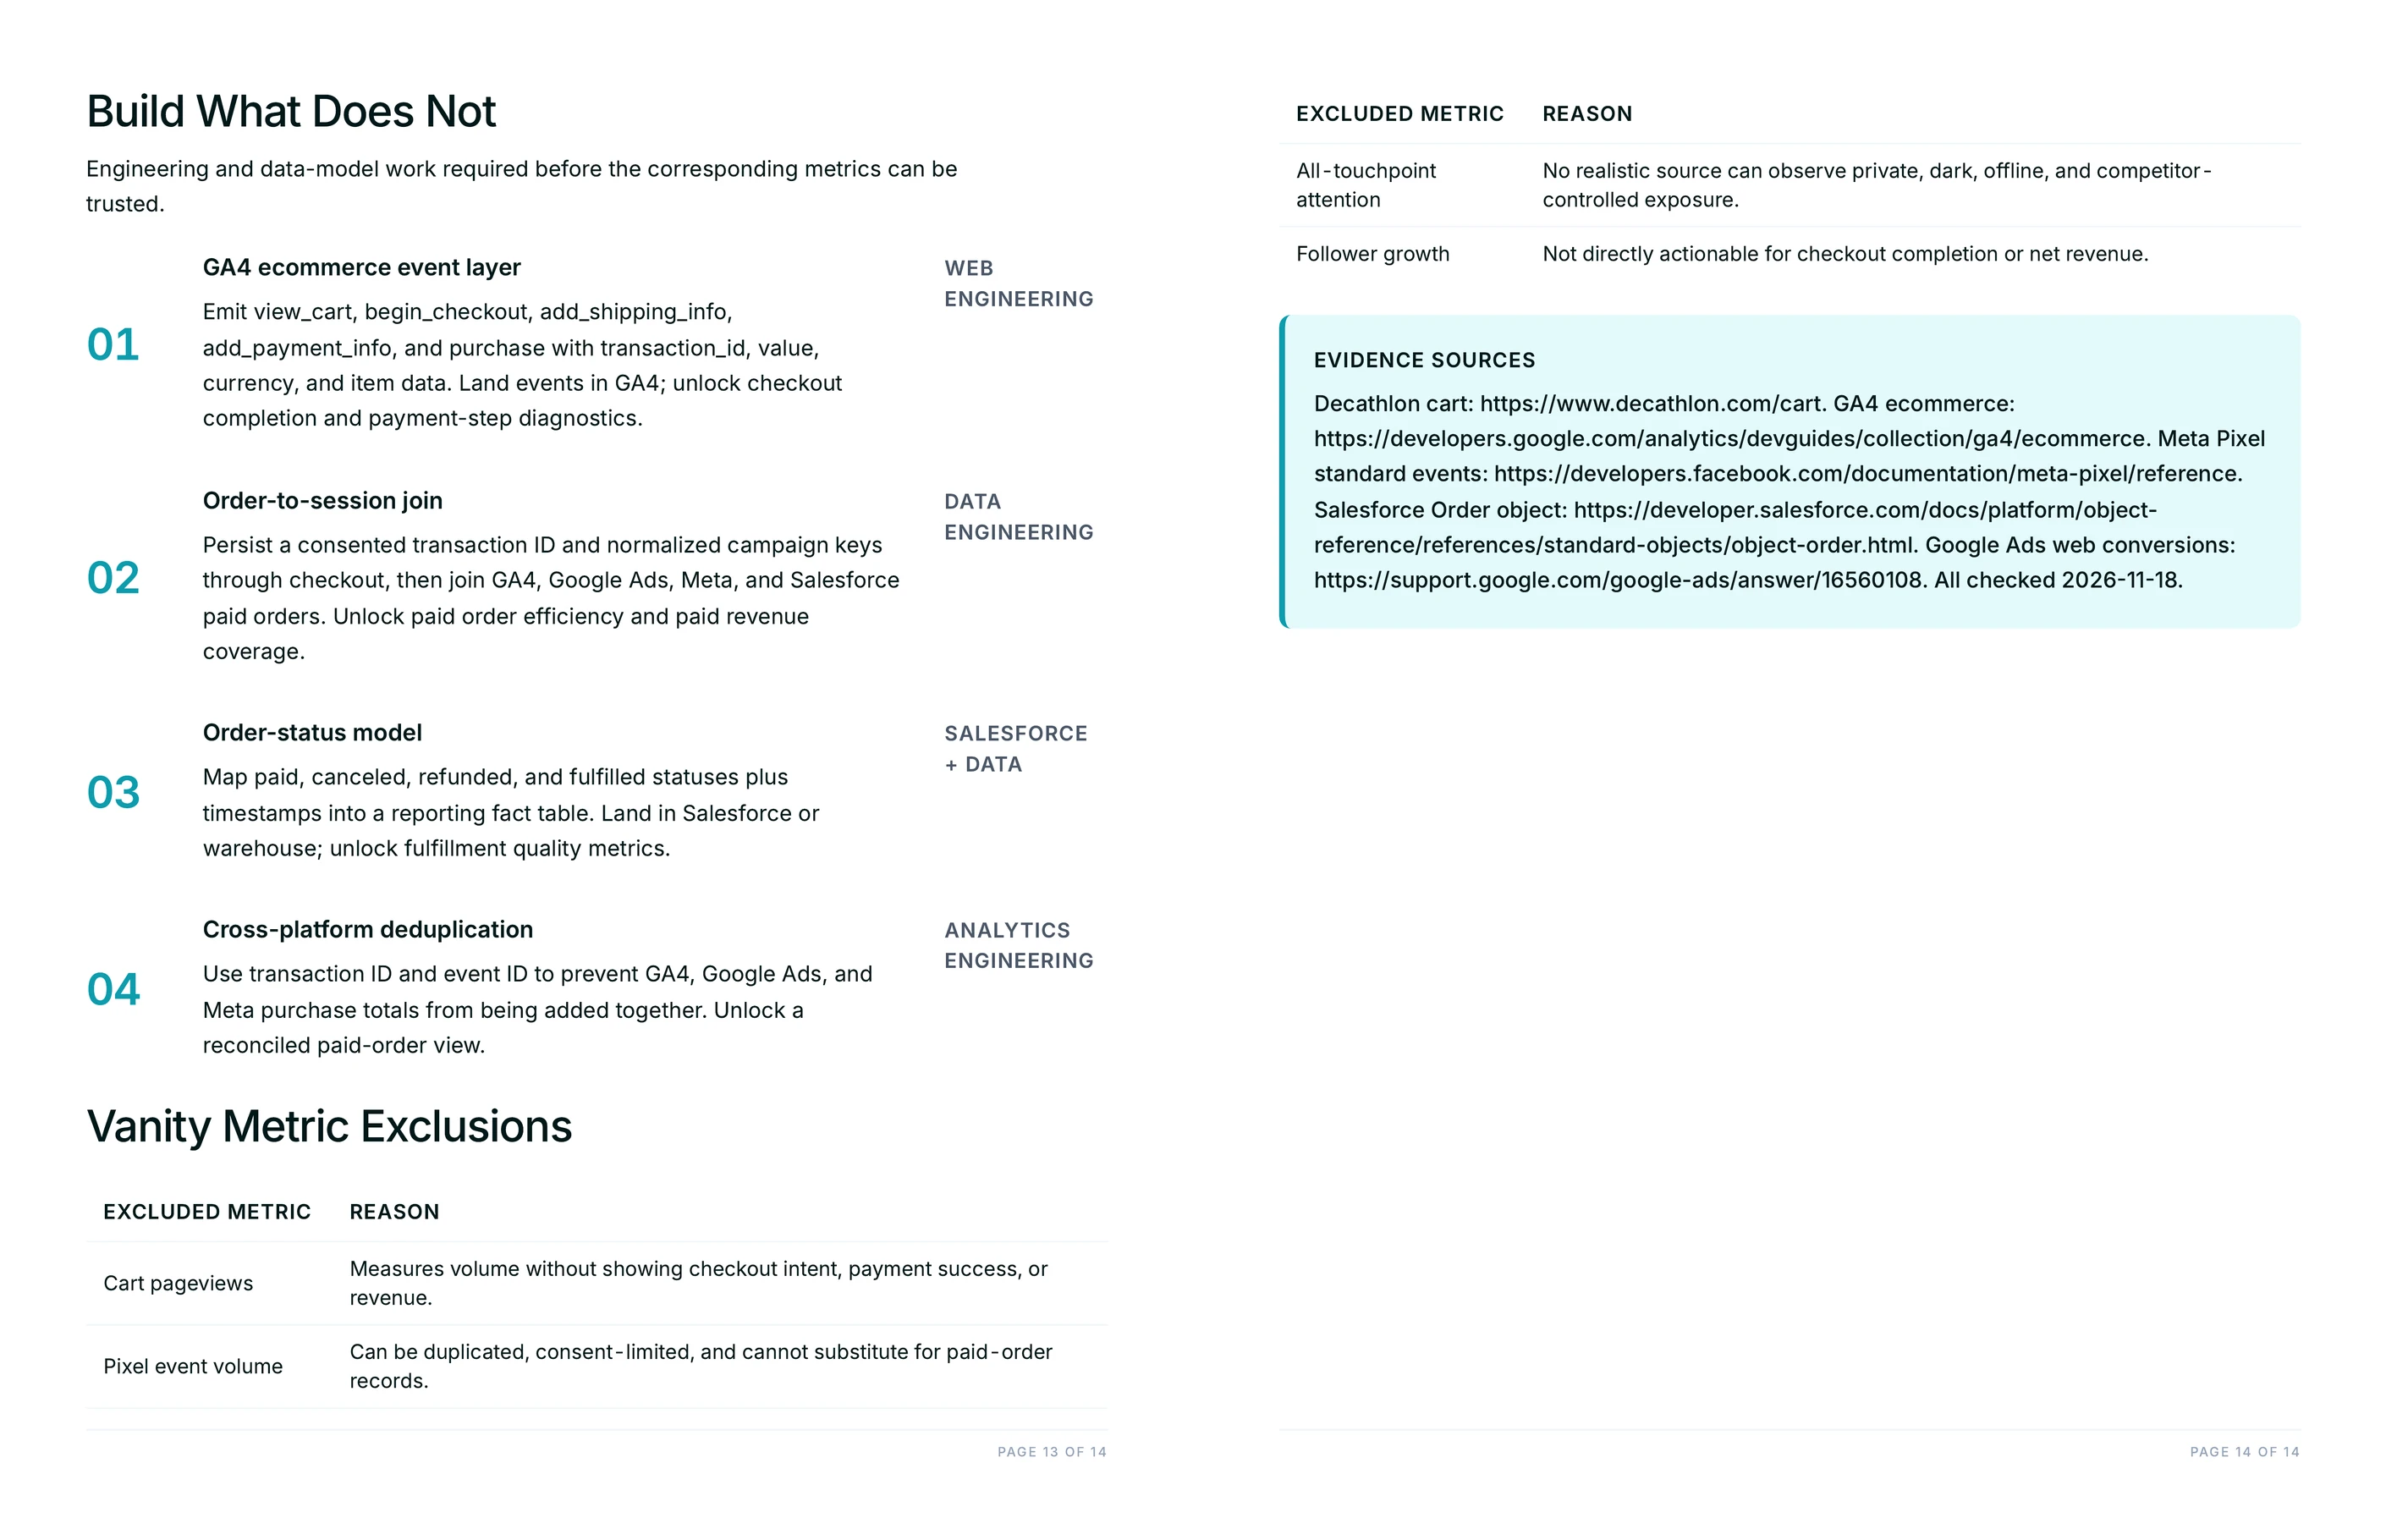
Two files. A branded PDF covering the metric tree, the KPI dictionary, the measurability audit with its evidence, the derived targets and their arithmetic, the instrumentation backlog, and the exclusion list. Alongside it, an editable CSV carrying every metric as a row.
The CSV columns are the working part: metric name, its parent in the tree, definition stating what counts and what does not, formula, source system, owner role, cadence, measurability status, and the evidence behind that status. It opens in a spreadsheet, so the analytics lead can change a definition in place and hand it on without retyping anything.
How does it decide what counts as measurable today?
By checking rather than assuming. Each status is backed by something observable: the measurement documentation a platform publishes, the conversion surfaces visible on the client's own site, or the integrations the stack is documented to support. The source and the date checked sit next to the status.
The useful distinction is between tracking an event and connecting it to money. Counting a signup is usually straightforward. Attributing revenue to the campaign that produced it needs an unbroken chain of identifiers from ad click to account to invoice, and the audit names the broken link instead of listing the metric as available.
Where do the targets come from?
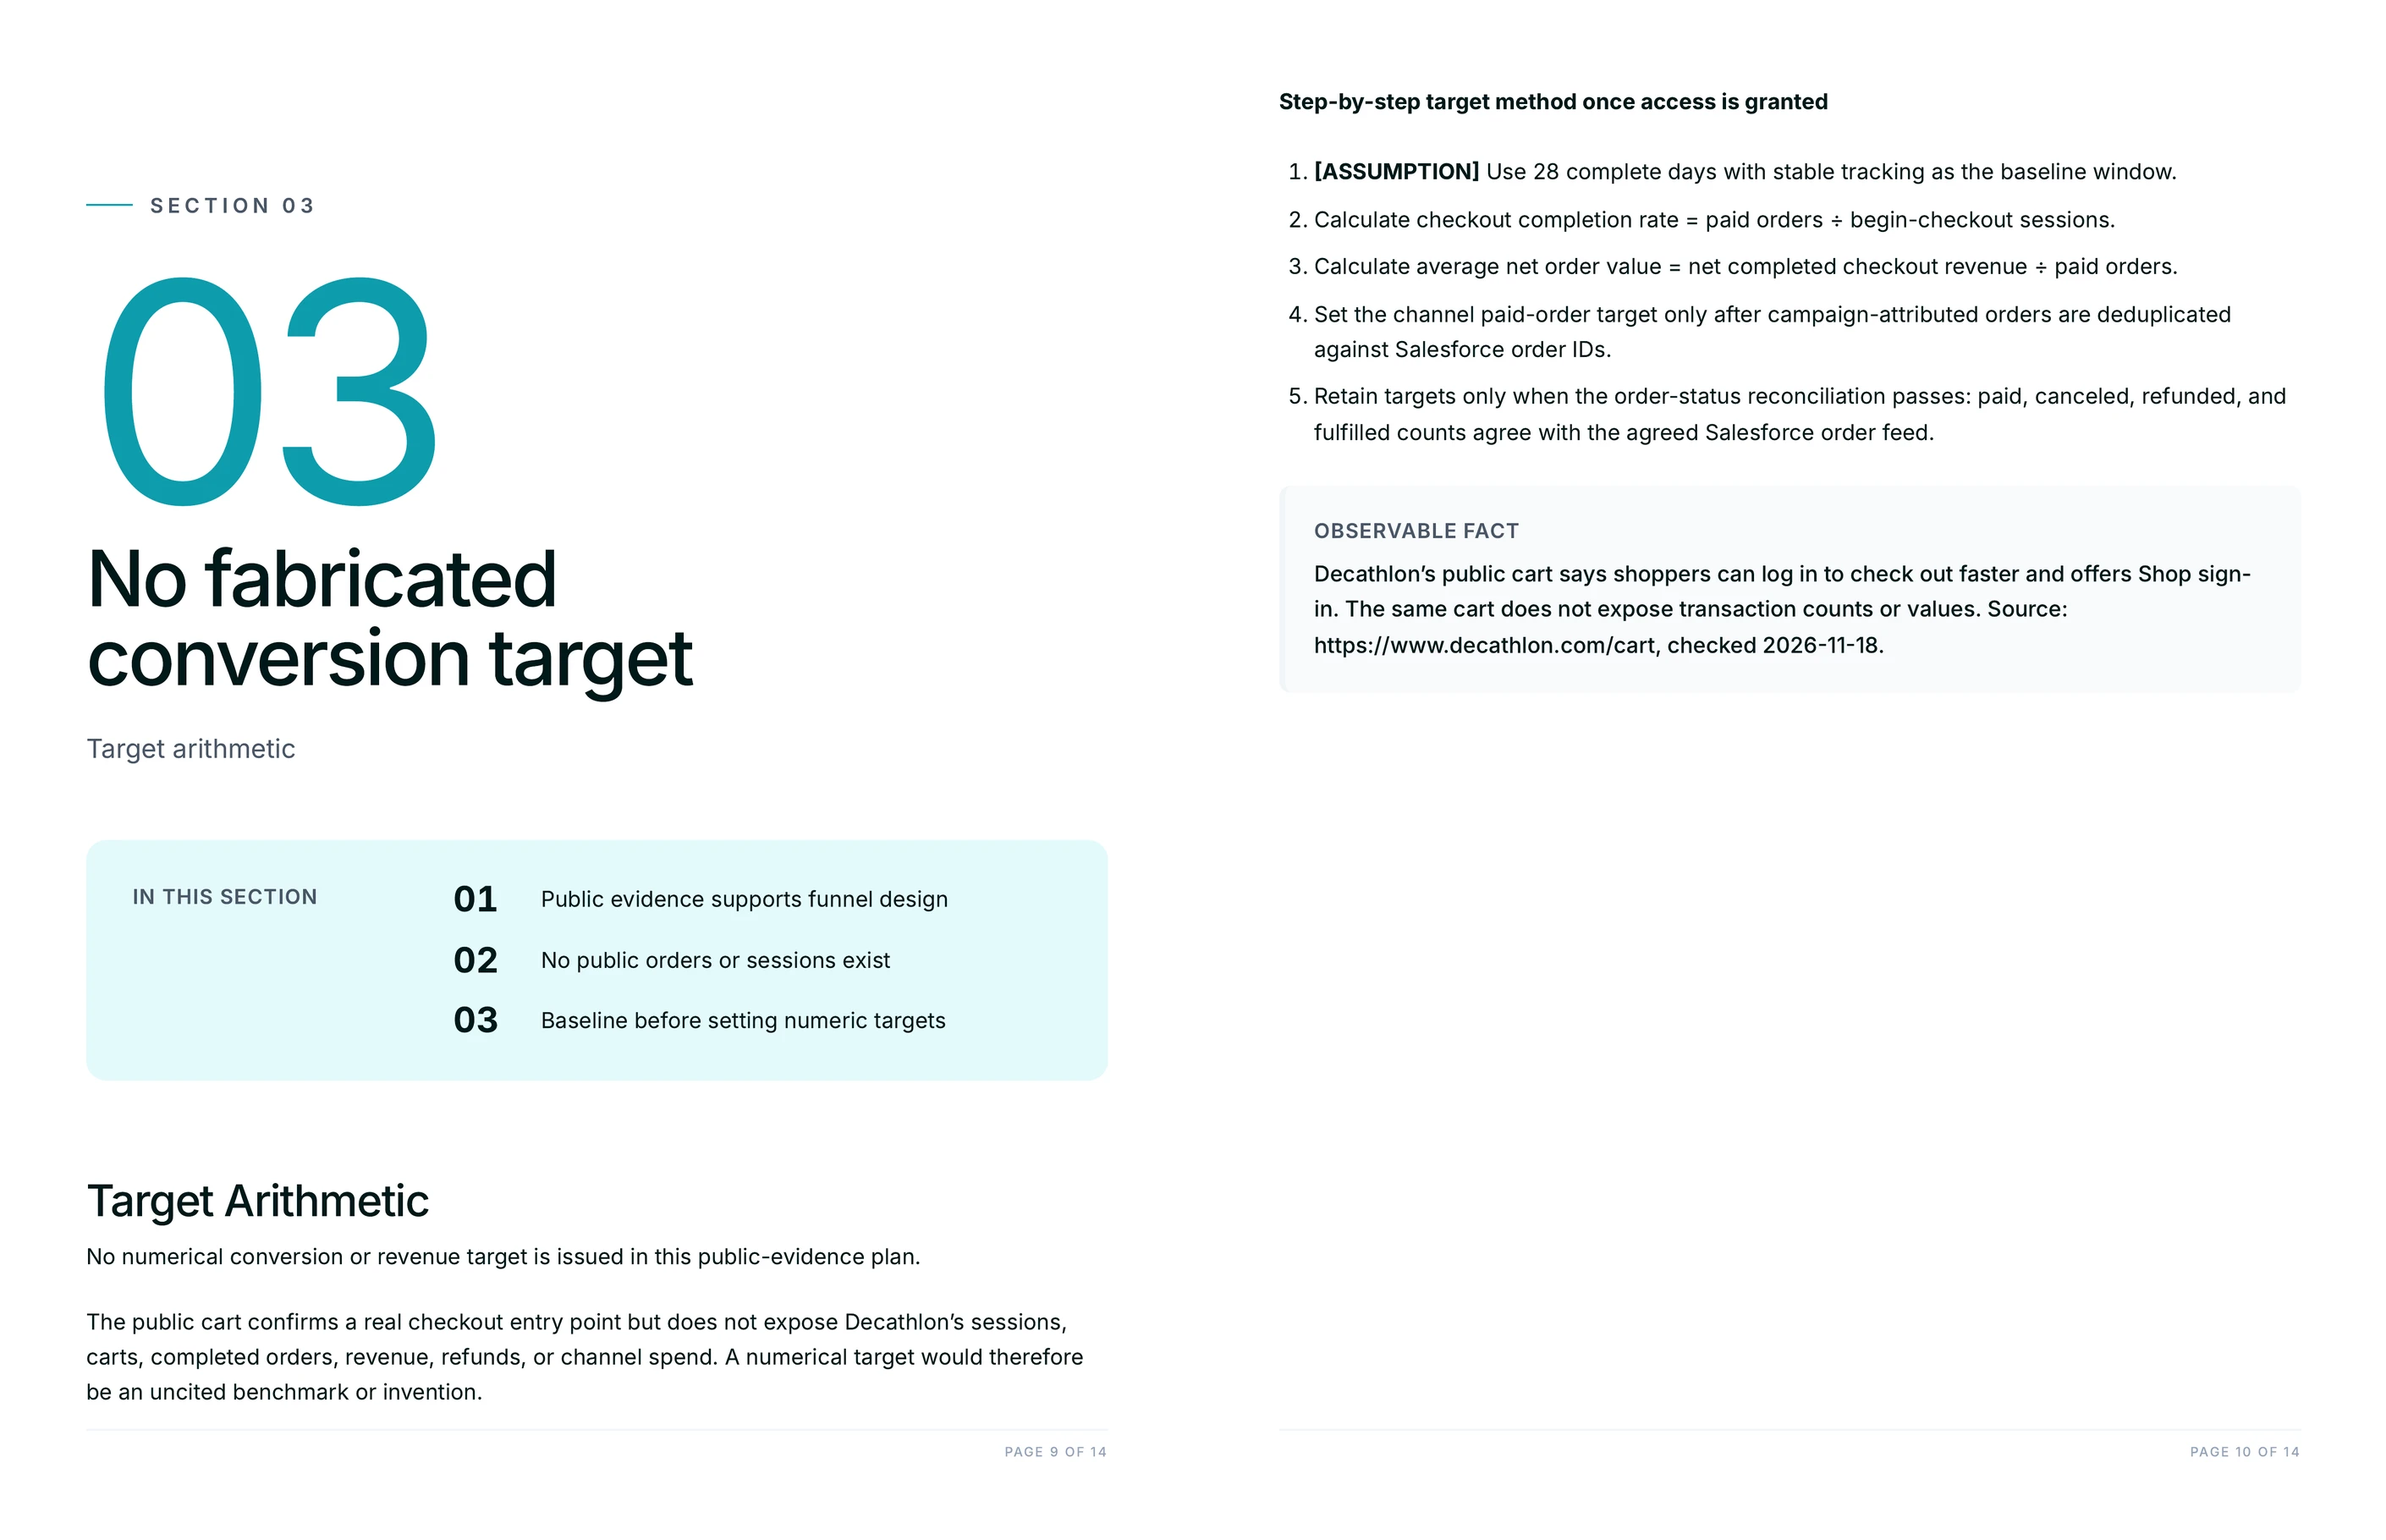
From the client's own funnel, with the arithmetic printed. The plan shows the inputs, the calculation, and the resulting figure for each primary KPI, and labels every assumption as an assumption so it can be replaced with a real number.
Unsourced industry benchmarks are deliberately left out. Where the available evidence will not support a defensible target, the plan says so and marks the KPI as needing a baseline period, which is a more useful answer than a confident number with nothing behind it.
How is this different from building the dashboard?
The dashboard comes second. This plan settles what the metrics mean, who owns them, how often they get reviewed, and which ones the stack can produce, which is the agreement a dashboard assumes already exists. Most reporting arguments are definition arguments in disguise.
Juma augments the team, it doesn't replace it. The analytics lead still chooses the north-star, sets what counts as a win, and decides which gaps are worth engineering time. What changes is that the definitions, the evidence, and the arithmetic arrive written down in the first draft instead of being reconstructed in a meeting.
Does this work for e-commerce as well as B2B?
Yes, and the tree comes out looking different, which is the point. A B2B plan runs through qualified meetings, pipeline, and payback, where the hard part is identity continuity across click, CRM record, and invoice. A retail plan runs through sessions, purchases, average order value, and repeat rate, where the hard part is usually cross-device and returns.
The structure holds either way: one north-star, primary KPIs with real definitions, diagnostics beneath them, honest statuses, and an exclusion list. What changes is which metrics earn a place and which joins turn out to be missing.