Analytics & Reporting
SEO
Google Search Console
Juma SEO Pulse
Juma SEO Scout
Juma SEO Pulse
PDF
PDF Icon
PDF
Google Search Console
Juma SEO Pulse
Juma SEO Scout
PDF
PDF Icon
Excel
Excel Icon

Run an SEO performance report with AI: a sourced scorecard, click-change attribution & a ranked action plan

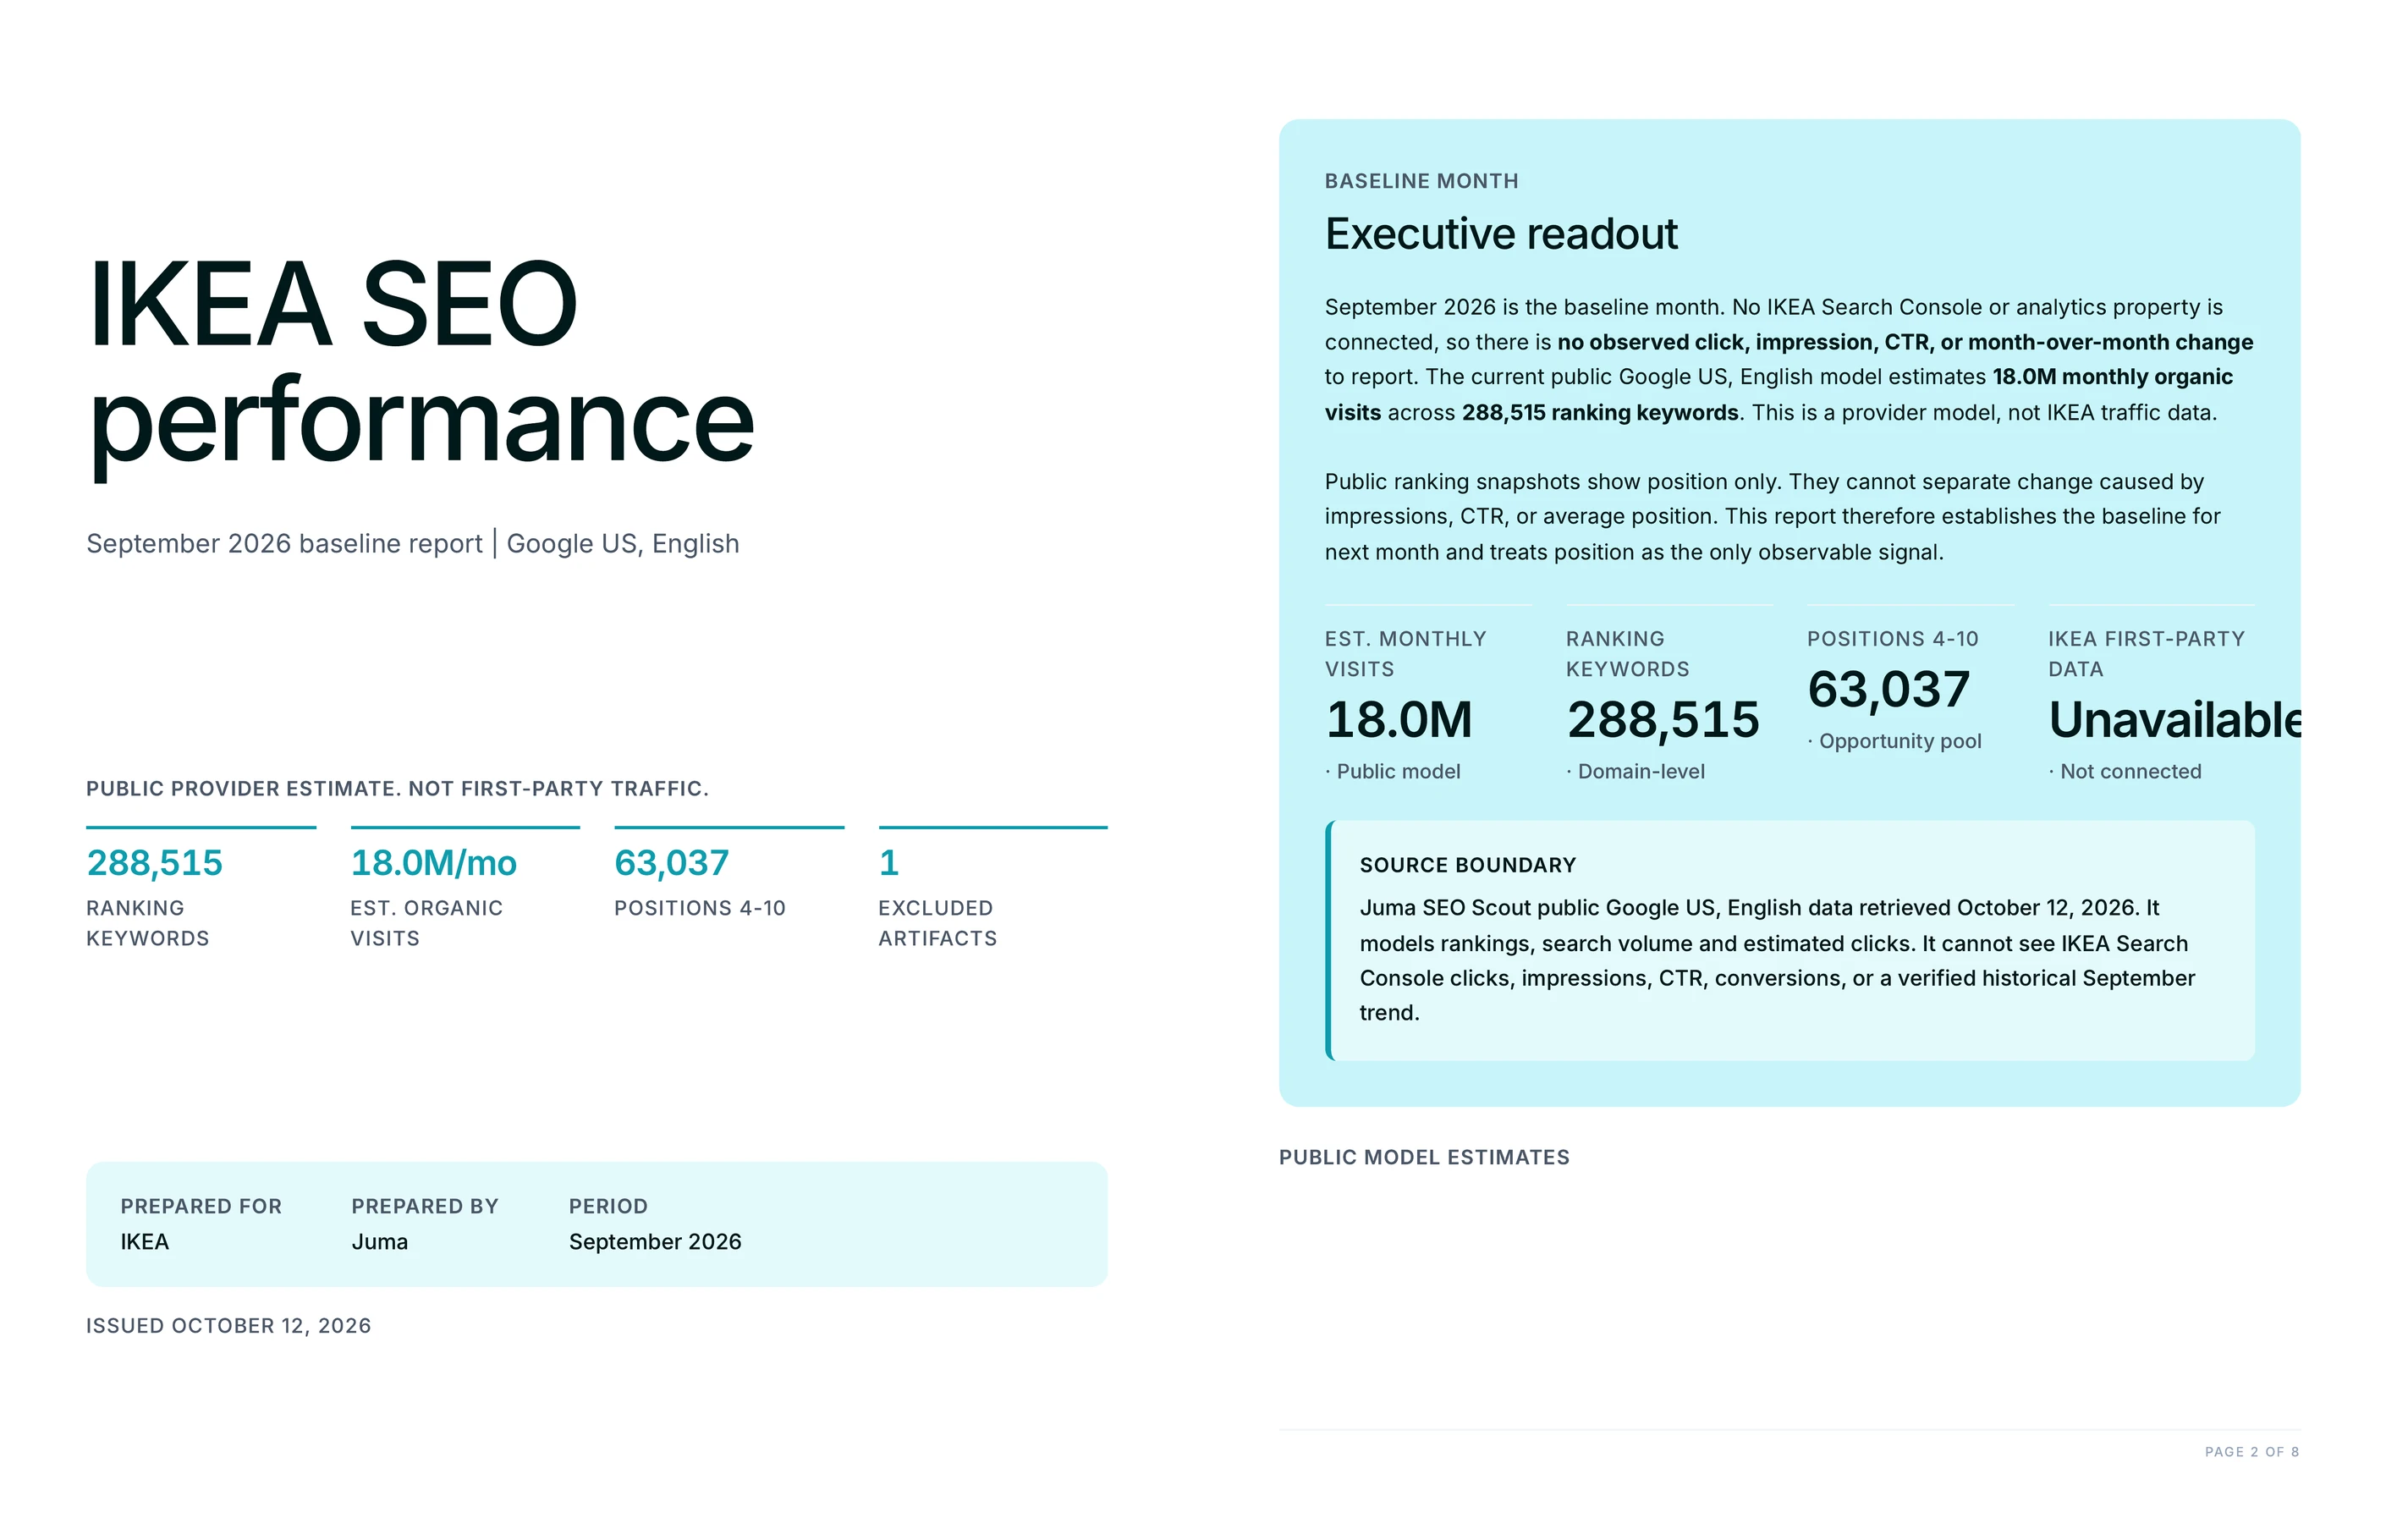
Name the client and the month, and the SEO performance report comes back with every number labelled by its source, each click change attributed to impressions, CTR or position, and an action plan ranked by expected click recovery.

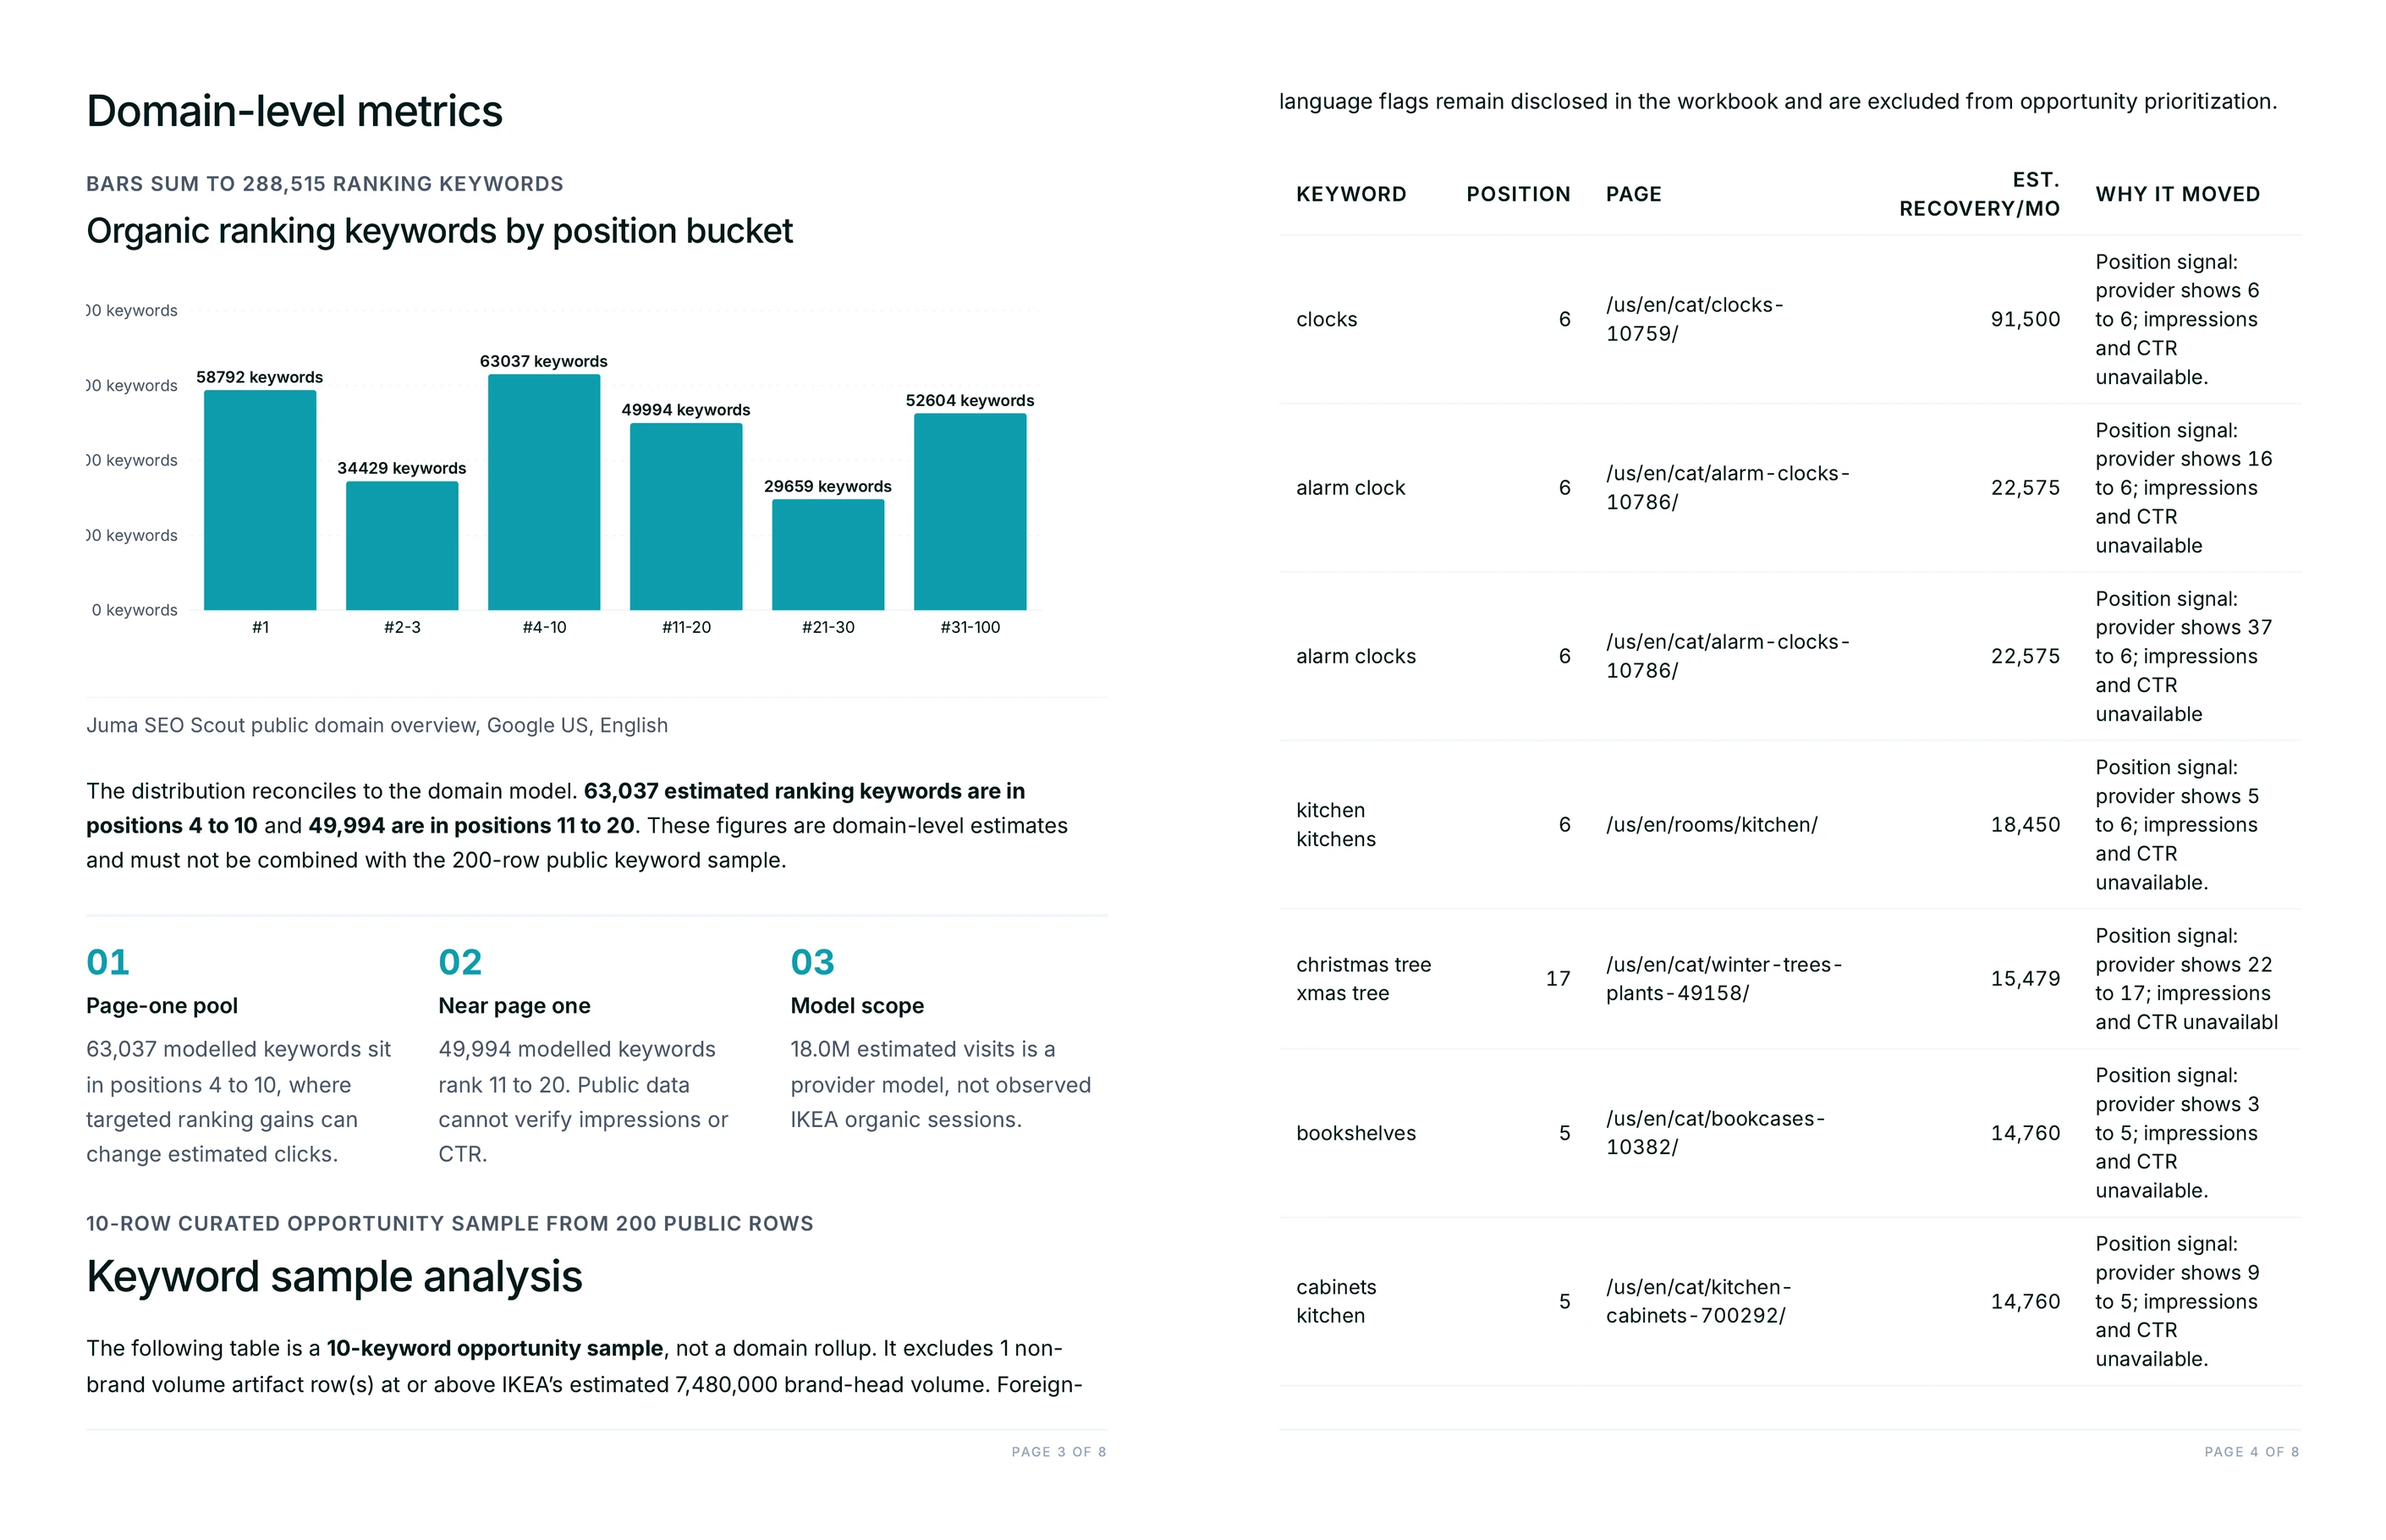
Name the client, their domain, and the month, and the Flow reads public Google ranking data across the whole domain, then adds first-party Search Console numbers for any property the team has already connected. Every figure arrives labelled with the source it came from and a plain note on what that source cannot see, so nothing modelled gets presented as measured. The report lands as a branded PDF holding the executive readout, the position-band distribution, and the ranked action plan, alongside an editable XLSX with the per-keyword and per-page tables behind it.

400+ marketing teams use Juma, and the reporting Flows are built to be run on the same client every month. The first run sets the baseline. From the second run on, the report carries real month-over-month movement, with each change traced back to impressions, CTR, or average position.

1

Run this month's SEO performance report

Thank you! Your submission has been received!
Oops! Something went wrong while submitting the form.
Try This Flow

Example Flow result

Hide details
  • Works on any domain, no setup. Public Google ranking data carries the whole report, so the first run needs no Search Console access, no property verification, and no export to prepare. Name a domain and the report starts.
  • Connect Search Console for the click layer. Once the property is connected, actual clicks, impressions, and CTR sit beside the public estimates rather than blended into them, and every movement gets attributed to impressions, CTR, or average position.
  • Name the month. "September 2026" or "last month" scopes the comparison. Without a period the report defaults to the latest complete month, which can cut a partial month in half.
  • Name the market. Rankings differ by country, so saying "US rankings" or "UK" scopes the visibility set to the market the client actually sells in.
  • Run it monthly. A comparison needs two data points. The first run sets the baseline, the second produces genuine month-over-month movement, and by the third the seasonal shape of the account starts to show.
  • Ask for the opportunity math. Request the search volume, current position, and expected click gain behind each recommendation so the team can see why one action sits above another on the plan.
2
Lightbulb Icon
Connect Search Console for the full picture
Public ranking data shows visibility. Search Console shows what people actually clicked. With the property connected, the report separates a drop in demand from a drop in rankings, which are two very different problems with two very different fixes.

How do you find out why organic clicks dropped?

A click number on its own starts an argument. This step settles it by decomposing the change: for each page that lost clicks, the report says whether impressions fell, CTR fell, or average position slipped, because a demand drop, a snippet problem, and a ranking loss each need a different response. Get the three biggest losing pages with the cause named per page and the matching next move, so the team spends the month fixing the real problem rather than rewriting title tags on a page that simply had less demand to capture.

Prompt
Copy

Take the three pages that lost the most clicks this month and tell me whether each one lost impressions, CTR, or position, and what to do about each.

Try This Flow
3

Which pages are closest to winning more clicks?

The pages sitting in positions four to twenty already rank, already match intent, and already carry authority, which makes them the cheapest clicks available in the account. This step pulls that growth pool out of the report and ranks it by upside rather than by position, so a page at number twelve on a high-volume term outranks a page at number five on a term nobody searches. Get the ten pages with the most click headroom, each with its search volume, current position, and the expected gain from moving it onto page one.

Prompt
Copy

List the ten pages in positions four to twenty with the most click upside, with the volume, current position, and expected gain behind each one.

Try This Flow
4

How do you turn an SEO report into a client-ready update?

A six-page report is the evidence. The thing a client reads on their phone before the call is one page. This step compresses the month into the headline number, the cause behind it, and the three actions the team is taking next, in language a marketing director can forward to a CFO without translating it first. Get a one-page update that leads with the direction of travel and keeps the full report underneath it as the audit trail, so the detail stays available for anyone who asks where a number came from.

Prompt
Copy

Turn this report into a one-page client update: the headline number, the cause, and the three actions we are taking next month.

Try This Flow
5

How much of the change is just seasonality?

Plenty of monthly SEO reports announce a crisis that was only August. Comparing a month against the same month a year earlier separates the trend from the calendar, and it is the check that stops a team from rebuilding a category page that drops every summer and recovers every September on its own. Get a year-over-year view beside the month-over-month one, with the share of the change that tracks last year's seasonal pattern called out separately from the share that does not, so the action plan only spends effort on movement that is genuinely new.

Prompt
Copy

Compare this month against the same month last year and tell me how much of the change is seasonal and how much is new.

Try This Flow

Set up your client project: priority pages, target keywords, and what shipped last month

One project per client is the model that makes reporting compound. The project holds what the open web cannot tell us: which pages the client actually cares about, which keywords the retainer is measured on, and what the team shipped since the last report. Add that context once and every month's report arrives already scoped to the work, instead of ranking the whole domain and leaving the team to find the rows that matter.

What to add

Priority pages and target keywords

The pages and queries the retainer is judged on. With these in the project, the report leads with movement on the terms the client asks about, and treats the rest of the domain as context.

What shipped last month

The change log: pages published, titles rewritten, redirects added, templates changed. This is what turns a report that describes movement into a report that explains it.

Reporting template and brand kit

The client's palette, logo, and the section order the team already reports in. Every month's PDF comes out in the same shape, so the client reads the report instead of relearning it.

Guide Juma with project info

Each knowledge item takes a one-line description telling Juma what it is for. Short and plain works better than thorough.

  • Priority pages and target keywords: "The pages and queries this retainer reports on. Lead the report with movement on these."
  • What shipped last month: "SEO work completed since the last report. Use it to explain movement, not just describe it."
  • Reporting template and brand kit: "The client's colours, logo, and our standard report section order. Apply to every PDF."
Juma Logo
See what actually moved your organic traffic

Frequently Asked Questions

What data does Juma need to run an SEO performance report?

A domain is enough. The report builds its baseline from public Google ranking data, so the first run needs no Search Console access, no property verification, and no export. Connecting Search Console adds the click layer: actual clicks, impressions, CTR, and the month-over-month attribution behind them.

The two sources stay separate in the report rather than blended together. Public figures are marked as estimates, Search Console figures are marked as measured, and each table states what its source cannot see. That separation is what makes the report safe to send to a client who will ask where a number came from.

What does the SEO performance report include?

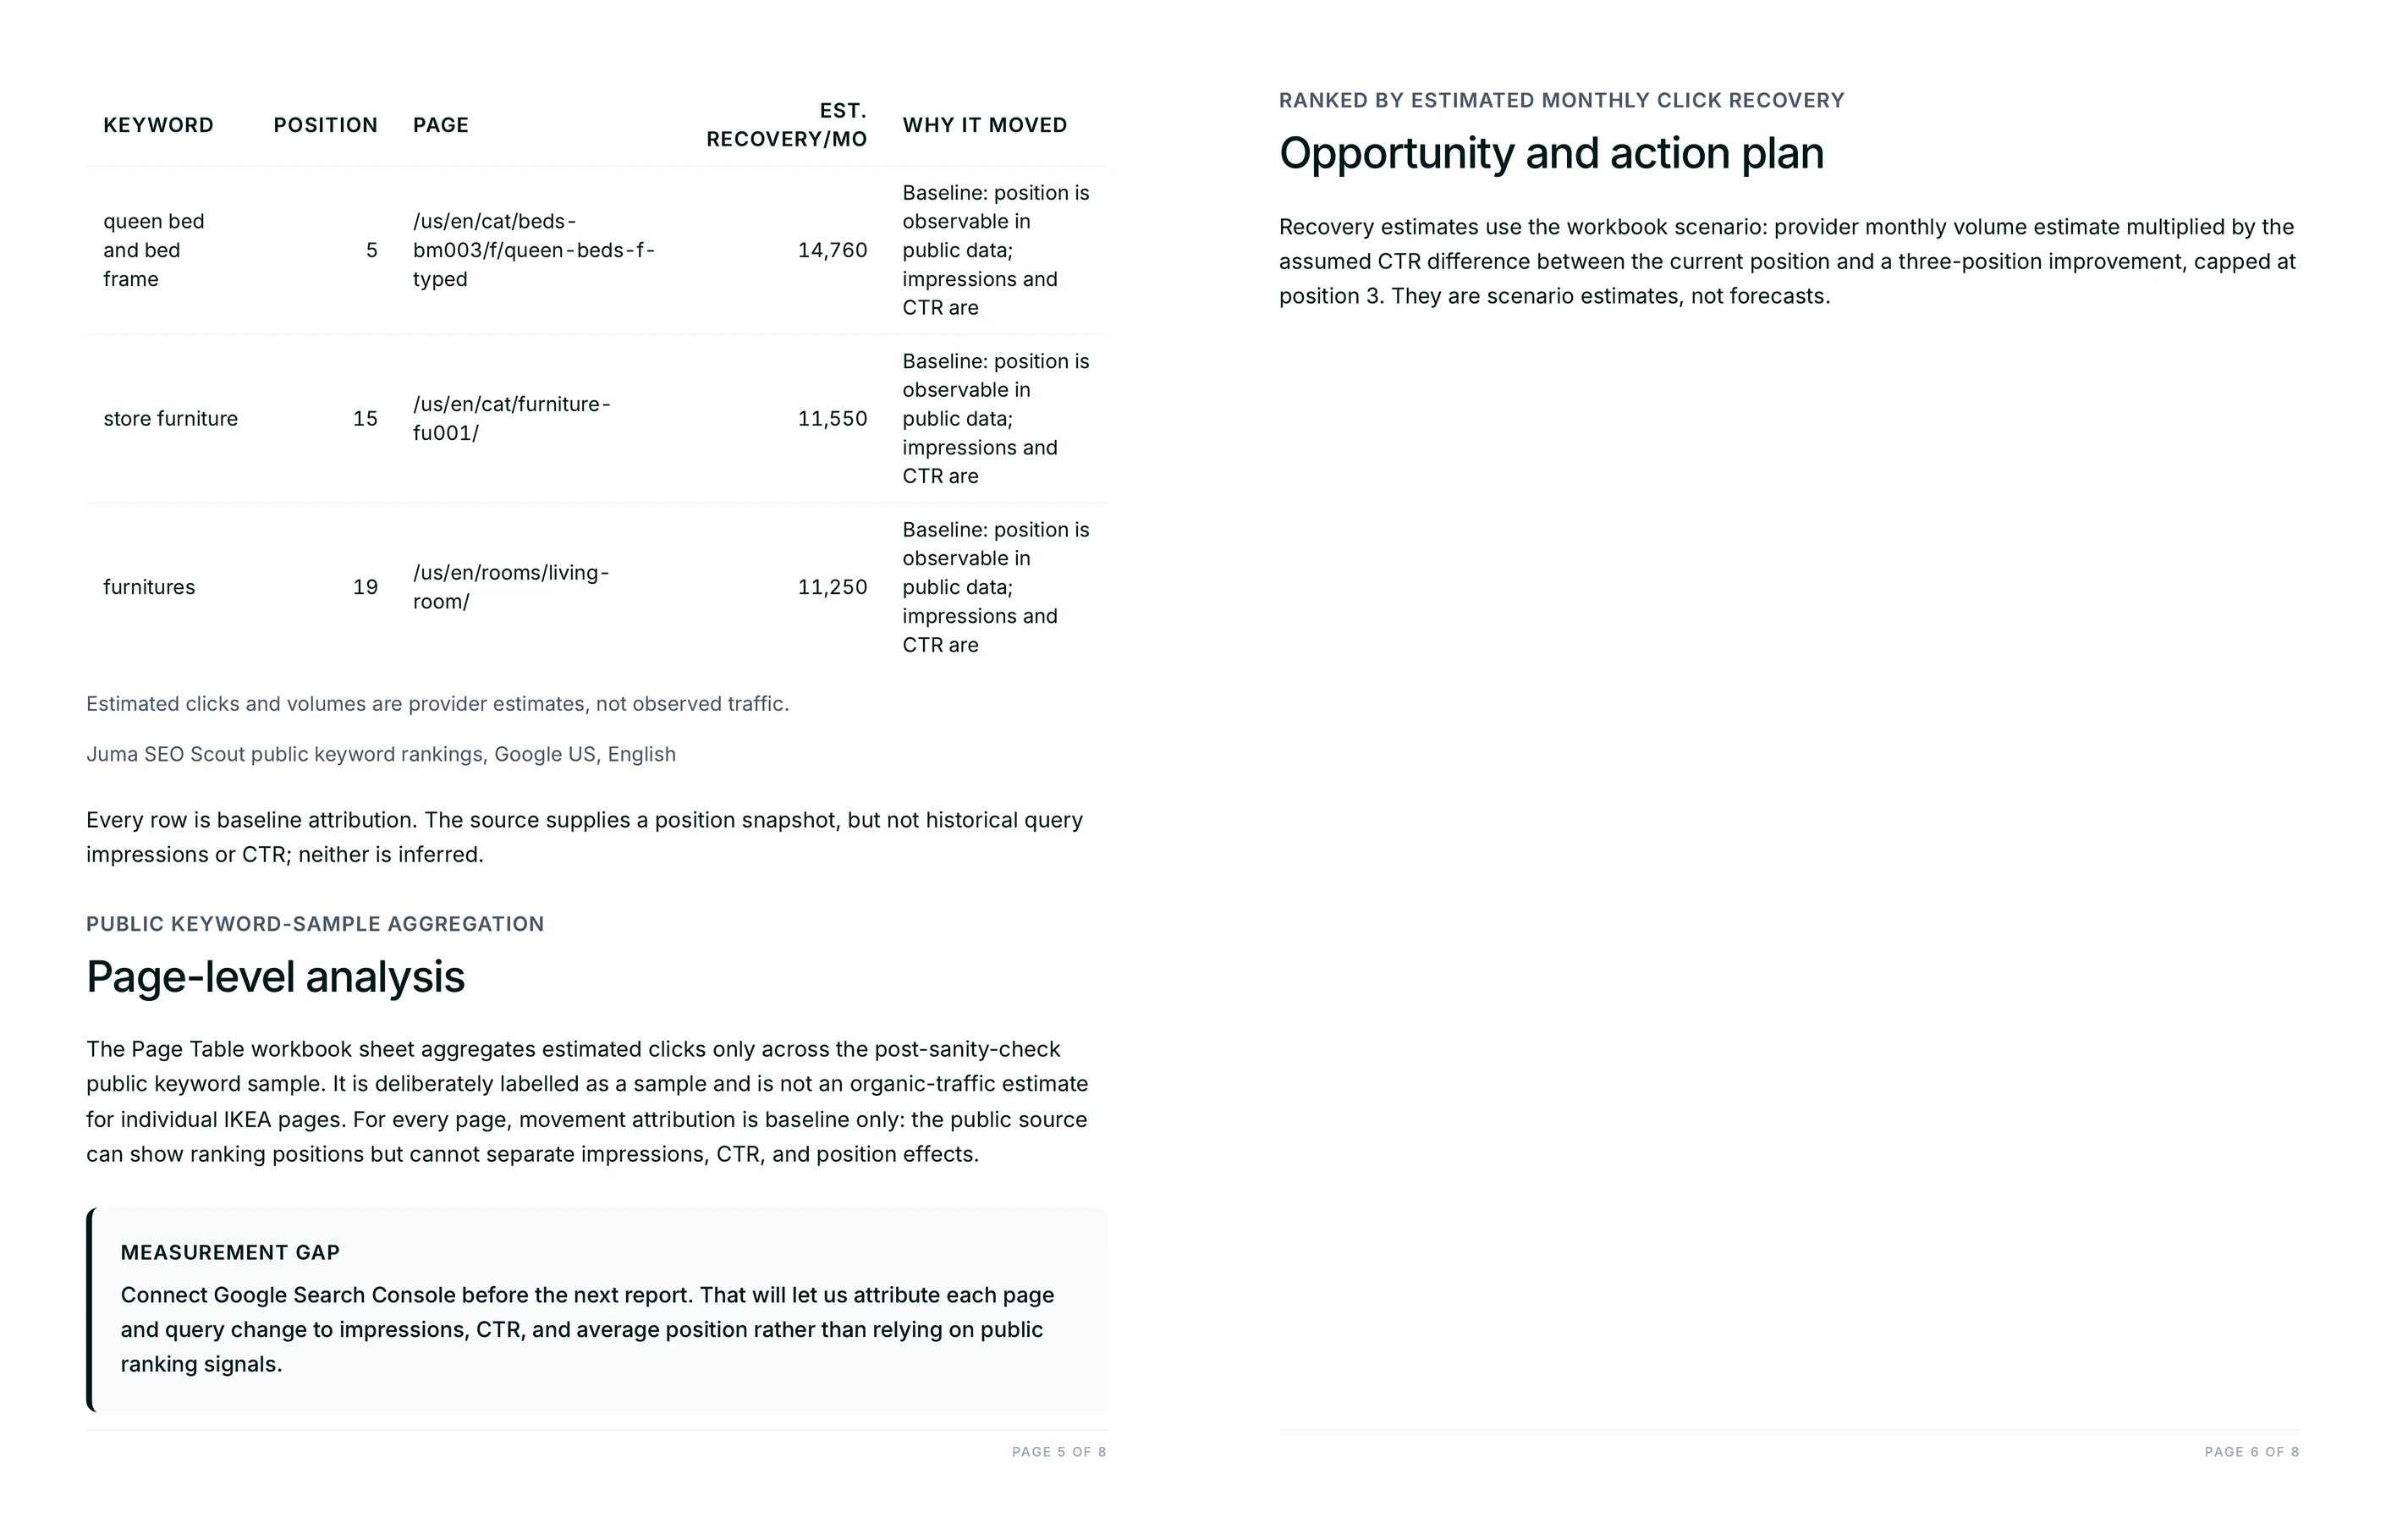
Two files. A branded PDF holding the executive readout, the headline scorecard, the position-band distribution, the landing-page and keyword evidence, and the ranked action plan. Alongside it, an editable XLSX with the full per-keyword and per-page tables so the SEO lead can pivot the data themselves.

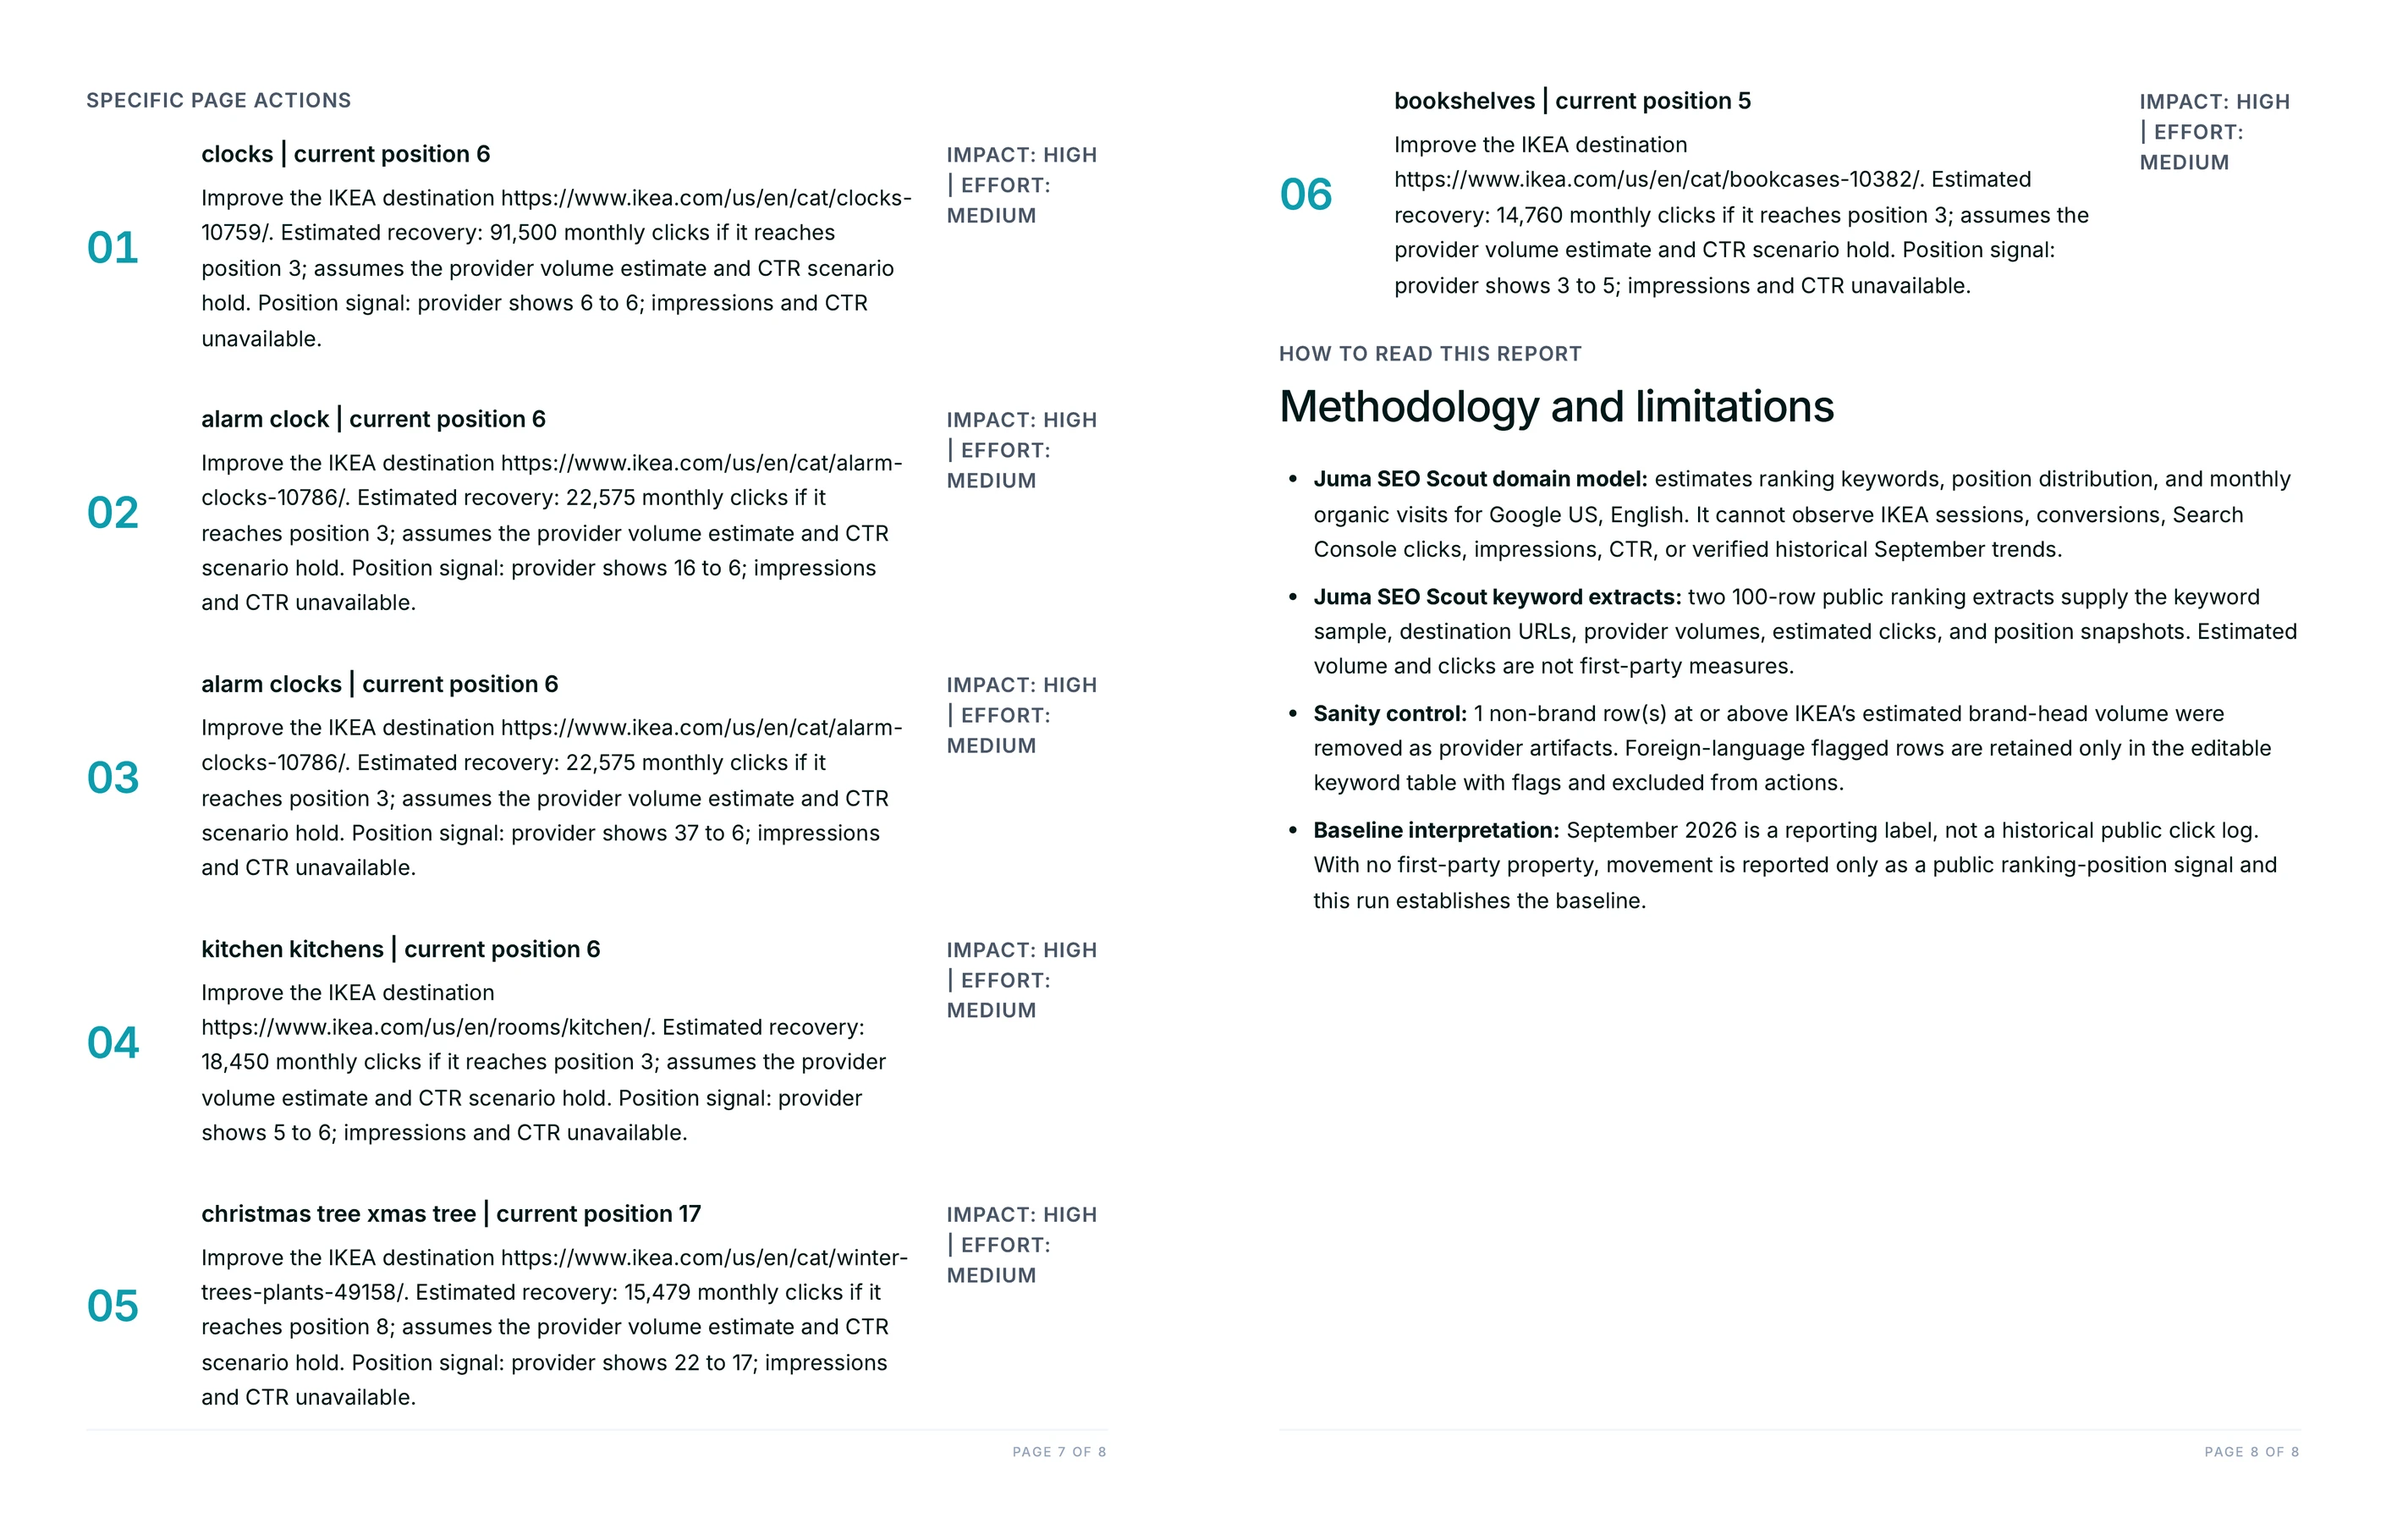
Every recommendation in the plan names the page or keyword it applies to, its current position, and the expected gain, ranked by the clicks it should win back. Generic advice gets cut, because "strengthen internal links" is not an action a team can put on a sprint board.

Can the report show month-over-month movement on the first run?

Not from public data alone. A comparison needs two observations, and a public ranking snapshot is current rather than historical, so the first run is explicitly labelled the baseline month. Where Search Console is connected, the history is already there and the first run carries real month-over-month movement immediately.

This is why the report states its period and its baseline status at the top rather than burying it in a methodology note. A client reading "baseline month" knows what they are looking at. A client reading an unlabelled flat number does not.

How does this compare to building the report by hand in Looker Studio?

A dashboard shows what changed. This report says why it changed, and it writes the answer down. The attribution step, deciding whether a page lost impressions, CTR, or position, is the part a human usually does in their head and never records, which is why last month's reasoning is gone by the time the next report is due.

The Flow does the pull, the decomposition, and the first draft of the narrative. Strategy, taste, and judgment stay human: which findings lead, what the client is told, and which of the ranked actions the team actually commits to next month are calls for the person who owns the account. Human review on every output.

Does this Flow work for an agency reporting on several clients?

Yes, and that is the case it was built for. One project per client keeps each account's priority pages, keyword set, change log, and brand kit separate, so running the Flow in a client's project produces that client's report in that client's shape without re-explaining the account each month.

Because the first run needs nothing but a domain, the same Flow also works on a prospect before anything is signed. A sourced visibility baseline with a ranked opportunity list is a credible thing to bring to a first call.

Don't take our word for it

Ask AI about us

400+ marketing teams trust Juma. ChatGPT, Claude, and Perplexity know why. Ask them.

Ready when you are

What's on your plate today?

Start typing a task and Juma will figure out the rest.

Thank you! Your submission has been received!
Oops! Something went wrong while submitting the form.