Set up your client project: price list, policies, tracked competitors, past tests
The teardown works from public pages on its own. Adding the client's own numbers to the project is what turns a comparison into a decision, because the gap that matters is the one the client can actually close at their margin.
What to add
Price list and margin floor
What each line sells for and how far it can move. Without it, every price gap looks equally closeable, and the recommendations drift toward discounting.
Shipping, returns and exchange policy
The client's own thresholds and terms in full, including what a return actually costs to process. The friction comparison is only useful next to those numbers.
The competitive set the team already tracks
Who the client considers a rival, and who they do not. It stops the set drifting toward whoever ranks well on the day.
Past test results
Experiments already run on the storefront and what they moved. The test plan then proposes things the team has not already tried and lost.
Guide Juma with project info
Each knowledge item takes a one-line description telling Juma how to use it. Keep them plain and specific.
- Price list and margin floor: "Only recommend price moves that stay above this floor, and say so when a gap cannot be closed on price."
- Shipping, returns and exchange policy: "Compare competitor friction against these exact terms, not against a general standard."
- Tracked competitive set: "Start from this set. Add a brand only if it sells the same category to the same shopper, and say why."
- Past test results: "Do not propose a test that has already run here. Reference the result instead."
See where a competitor is winning the sale
Frequently Asked Questions
How does AI analyze e-commerce competitors?
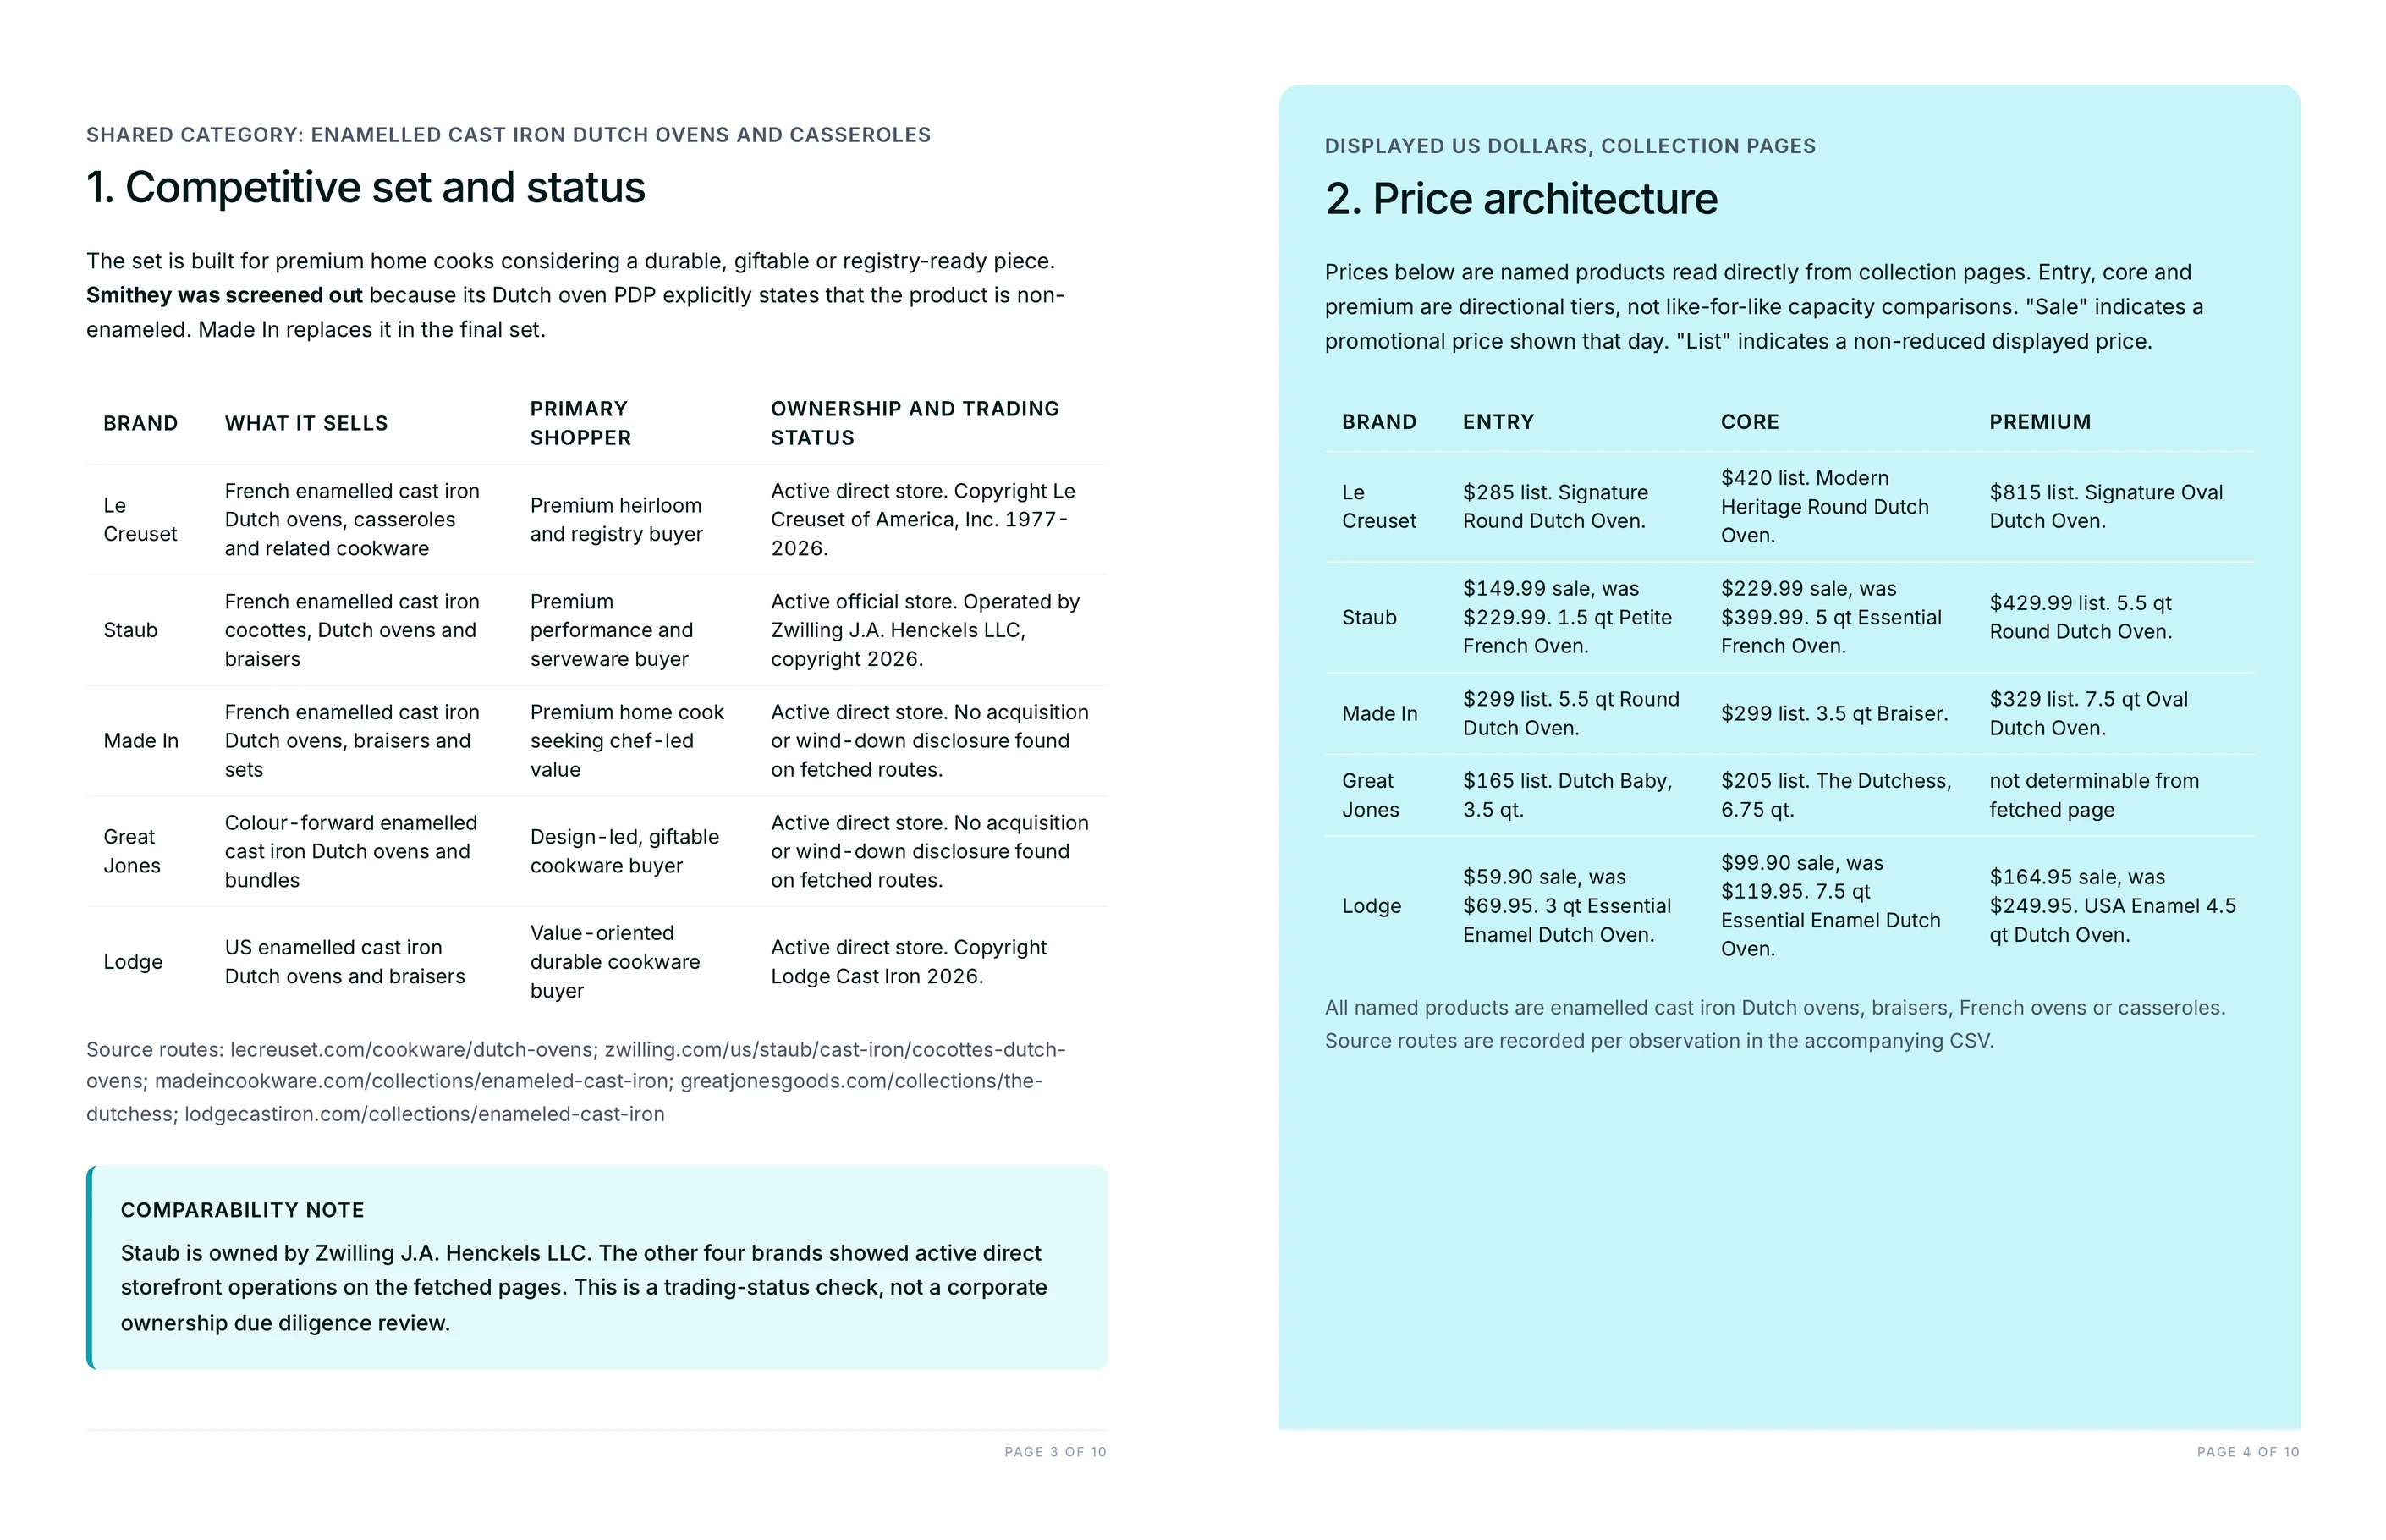
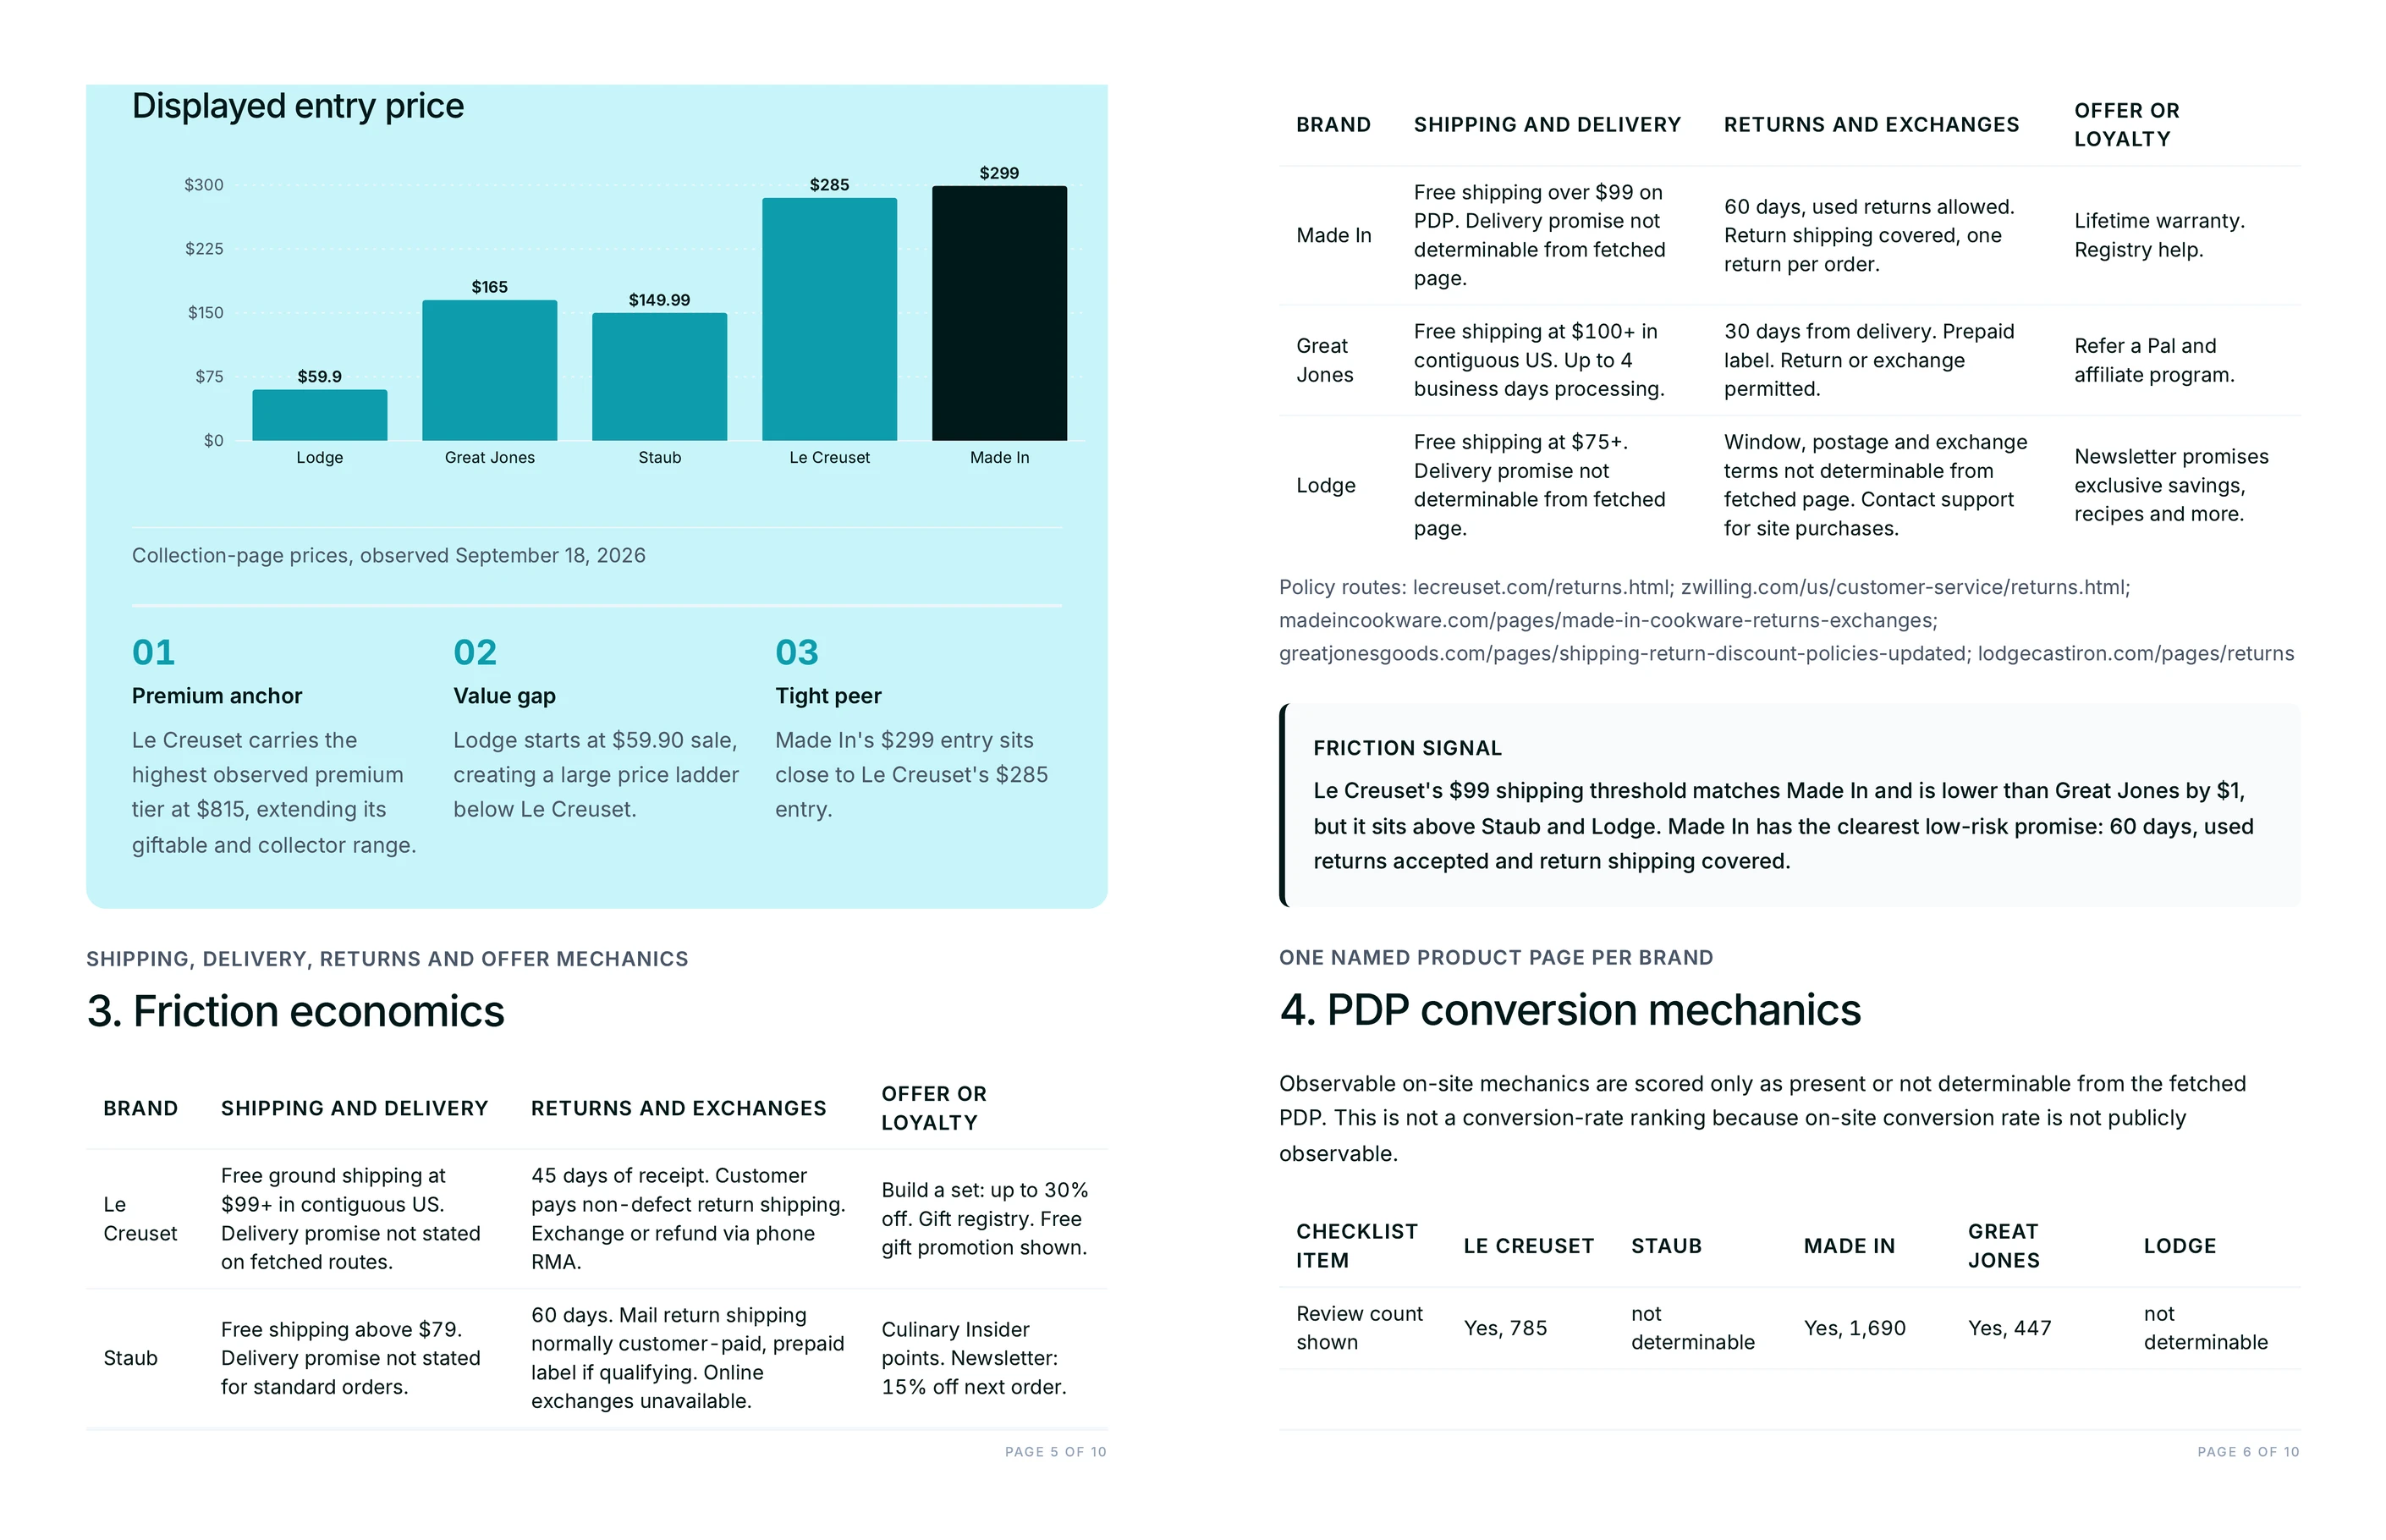
Juma opens each competitor's live storefront and records what is actually published there: the entry, core and premium price in one named category, the free-shipping threshold, the delivery promise, the return window, who pays return postage, and which conversion mechanics appear on the product page. Every cell carries its source URL and the date it was read.
The fixed checklist is what makes the result a comparison rather than four write-ups side by side. The same ten product-page mechanics get checked on every brand, each marked observed or not observed with the page it was seen on, so a gap is a gap and not an artefact of one brand getting a more thorough read than another.
Can it tell us which competitor converts better?
No, and a teardown that claims to is guessing. Site conversion rate is not published by anyone, and third-party traffic estimates do not resolve to a purchase rate. The flow states that limit on the page rather than working around it.
What it does instead is score the mechanics that conversion work targets: fit and sizing guidance, review counts, customer photos, instalment payments, comparison against sibling products, bundles, urgency signals, video, live chat. Those are all observable on a public page, and a gap in them is something the team can test. Revenue and growth figures, where a brand publishes them, go in as context and are labelled as what they are, not as proxies for conversion.
How is this different from a general competitor analysis?
A general competitor analysis maps positioning, messaging and content: what rivals say and where they say it. This one maps the commercial mechanics of the storefront: what they charge, what they charge to ship it back, and what the product page does to get the shopper over the line.
The two answer different questions and pair well. Run the positioning work when the question is how to sound different, and run this when the question is why a shopper who reached the product page bought somewhere else. Teams often run both against the same set and keep the two trackers side by side.
How current are the prices and policies?
They are as current as the run, which is why every cell carries an observation date. Storefront pricing moves with promotions, and a threshold or a return window can change without any announcement, so a teardown that does not date itself starts misleading people within weeks.
Each price is also marked list or promotional as observed that day. Re-reading the same points on a later date and marking which held is the cheapest way to tell a genuine repositioning from a sale that never ends, and it takes one follow-up prompt rather than a fresh audit.
What do we get back, and can we keep using it?
Two files. A branded teardown covering the competitive set and each brand's trading status, the price architecture, the friction economics, the product-page scorecard, an explicit list of what could not be verified and why, and a gap-to-action plan where every action names the observed fact behind it and the metric it should move. And an editable CSV with one row per observation, with source URL and observed date in their own columns.
The CSV is the part that keeps working. Re-read one brand when it moves, paste the rows over the old ones, and the next quarterly review opens on what changed instead of on an argument about method. Human review on every output.







.webp)
.webp)