Set up your client project: performance targets and campaign context
Teams build one Juma project per client and add context over time. Every flow the team runs for that client pulls from the same project. If a project already exists, adding ad performance context means each audit starts from the client's targets and history instead of industry benchmarks alone.
What to add
Campaign Analysis Context
Performance targets by objective (target CPA, target ROAS, target cost per add-to-cart, frequency caps), which campaigns to prioritise, and standing constraints. With this in the project, every audit measures against the client's own goals instead of asking about them each time.
Past Performance Data
Historical baselines: last quarter's CPA, ROAS, CPM, and conversion volume by campaign. When this exists, the audit compares against the client's own trajectory, not just industry averages. If the client's ad account is already connected, Juma can pull historical data directly, so this file becomes optional.
Creative Library Notes
Which creative concepts the team has tested, which won, which underperformed, and which are scheduled to refresh. This shapes the creative fatigue analysis because the audit knows which ads are old wins still being milked and which are recent tests still in their learning phase.
Client Brief
Company context, product lines, target audience, competitive positioning. This gives the analysis business context so recommendations connect to strategy, not just numbers. Useful when the audit needs to weigh a CPA tradeoff against a brand goal the data alone cannot see.
Guide Juma with project info
Add a short description to each knowledge item in the project info field so Juma knows what each file contains and when to use it. For example:
- Campaign Analysis Context: "Meta Ads targets and constraints. Read this before pulling data."
- Past Performance Data: "Historical CPA, ROAS, and CPM by campaign. Compare current results against these baselines."
- Creative Library Notes: "Which creatives have been tested and what we learned. Use to interpret creative fatigue findings."
- Client Brief: "Company context for strategic framing of recommendations."
See where your Meta Ads budget is actually going
Frequently Asked Questions
How much time does this Flow save compared to running a Meta Ads audit manually?
Running a Meta Ads audit manually takes 2 to 4 hours per account to cover campaign settings, budget pacing, creative-level performance, placement breakdowns, and frequency analysis. Juma completes the same analysis in minutes and delivers a formatted, client-ready PDF. Teams auditing multiple accounts per month recover the equivalent of a full working day each month without sacrificing depth or consistency.
For agencies running audits across multiple client accounts, the time savings compound. A team auditing four accounts per month recovers roughly 8 to 16 hours of analysis work, and the output is more consistent because the same structure applies to every account. There is no variation in what gets checked based on who runs the audit.
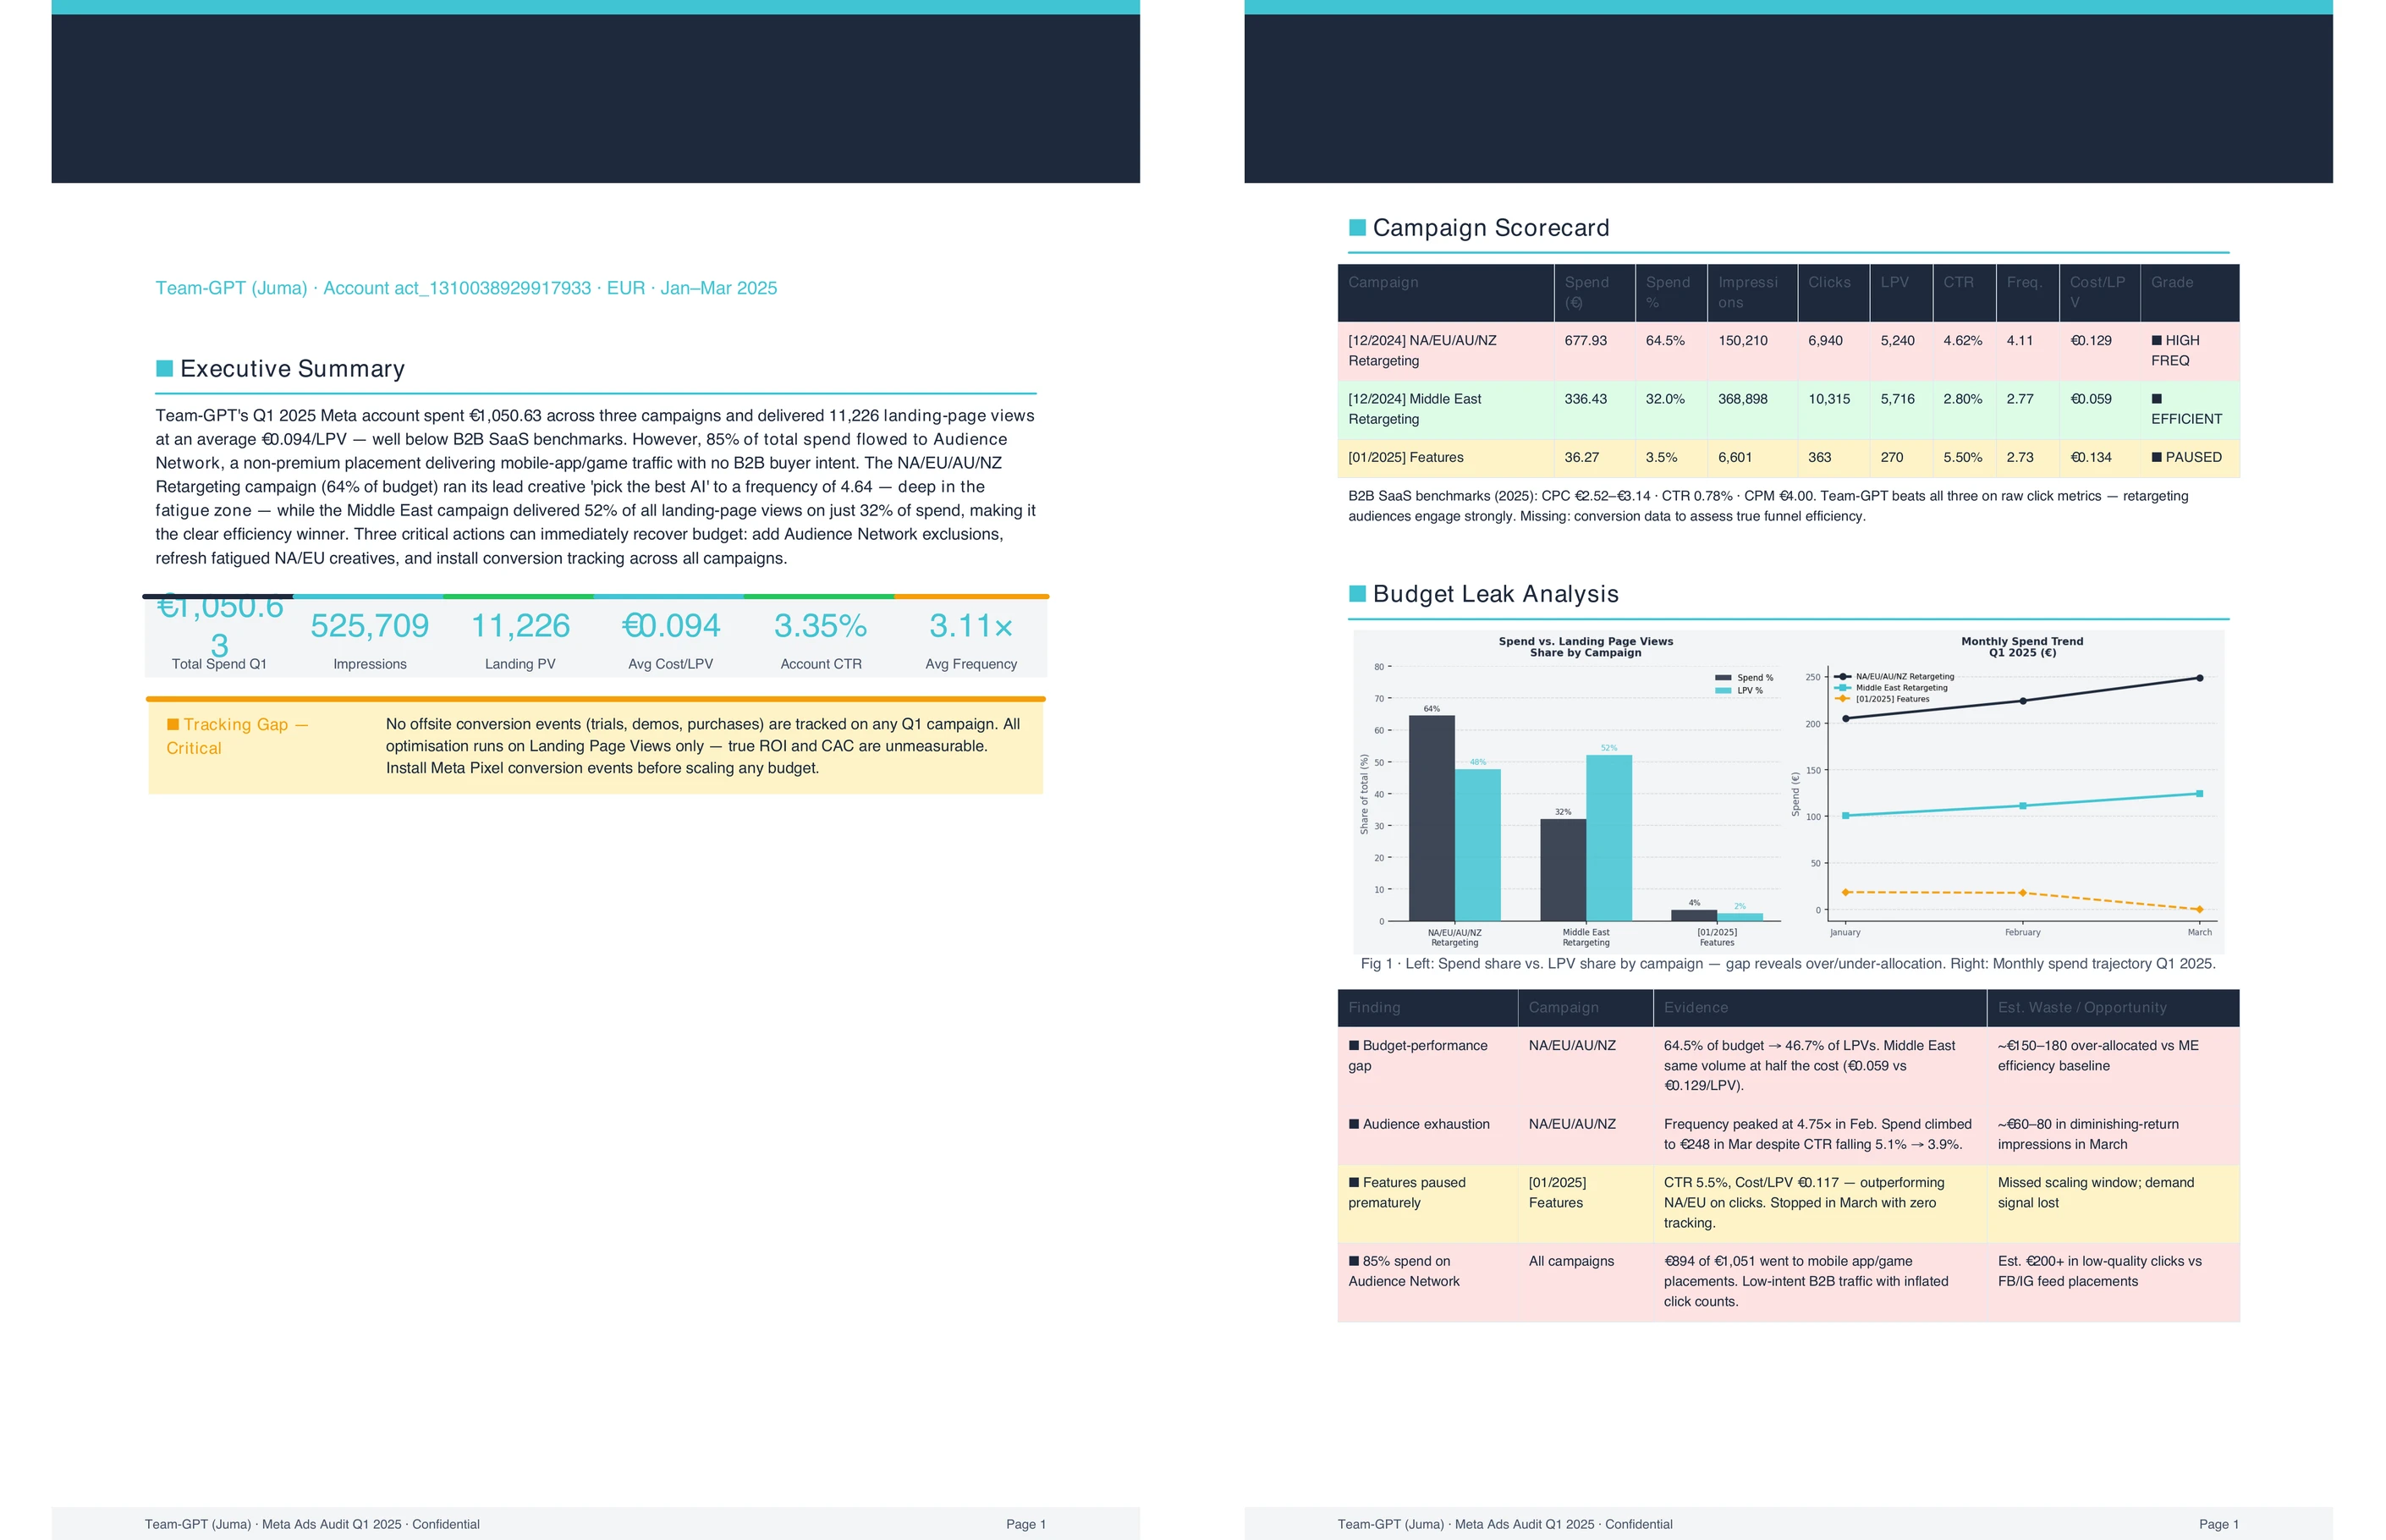
What does the campaign scorecard include?
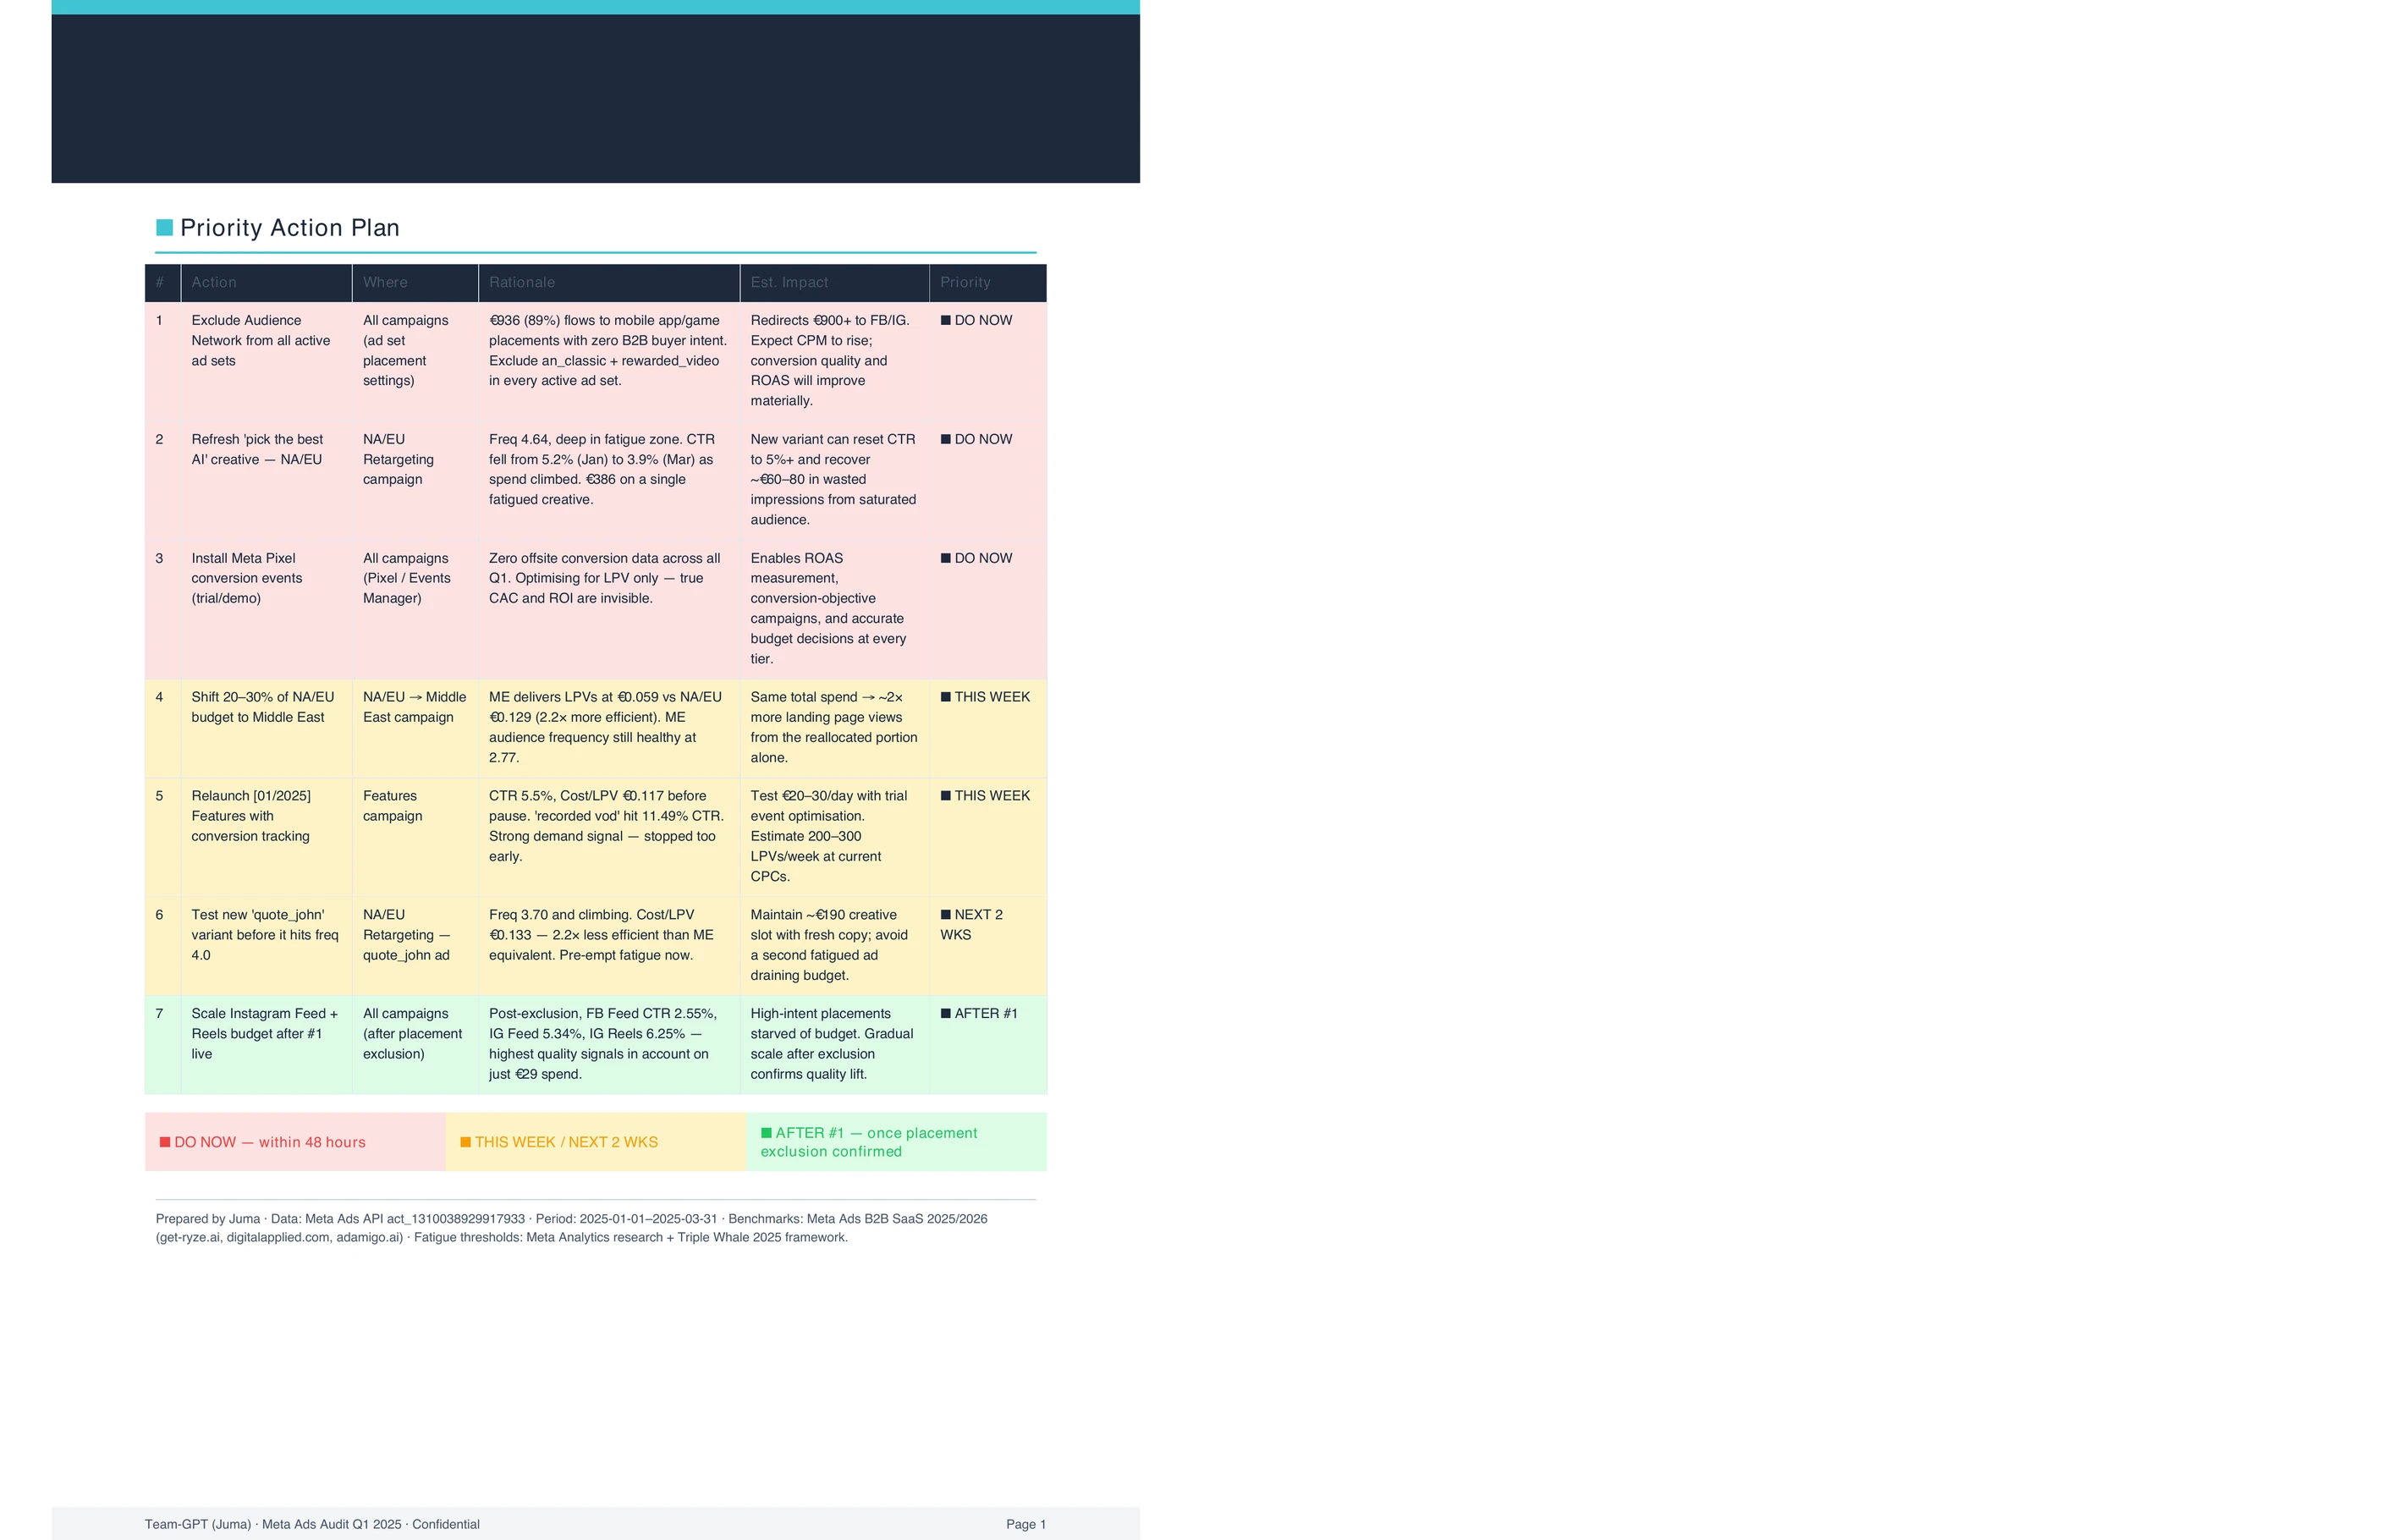
The campaign scorecard ranks every campaign by efficiency, showing spend share against conversion share side by side. It flags campaigns where budget is disproportionate to results, calls out creative fatigue at the ad level using frequency and CTR decay, breaks down spend by placement to show where each dollar is performing best, and ends with an action plan table that specifies what to cut, consolidate, or scale.
The efficiency ranking orders campaigns from best to worst based on the ratio of conversions delivered to budget consumed. A campaign with high spend share and low conversion share sits at the bottom. A campaign with low spend share and high conversion share sits at the top, and the plan section calls out scaling it.
Spend-to-result charts visualise the gap at a glance. For clients who respond better to visual comparisons than tables, the chart section makes the imbalance obvious without explanation. The action plan table then translates what the charts show into specific next steps, campaign by campaign.
Does the analysis identify wasted ad spend specifically?
Yes. The analysis finds where budget is going relative to where results are coming from, then breaks the waste into three categories: campaigns delivering no meaningful results (flagged for pause or restructure), creatives in fatigue that should be refreshed before more spend goes through them, and placements where the spend-to-conversion ratio is materially worse than the account average. All three categories appear in the same report.
Calling out the three types together gives the team a clear priority order. Creative refreshes are usually the fastest budget win because Meta ads decay faster than search ads do. Placement adjustments are the second move because they require only a bid or exclusion change, not a full restructure. Campaign-level decisions take more planning to execute and sit at the bottom of the priority list unless one campaign is dominating spend share.
The action plan table in the PDF specifies what to cut, what to consolidate, and what to scale, with the spend and conversion numbers behind each call. Every recommendation connects to data the client can see in the same document.
What data does Juma need to run the analysis?
Juma needs Meta Ads campaign performance data for the chosen time period. The simplest option is connecting the Meta Ads account: the integration pulls live campaign data, ad-level performance with breakdowns by placement and creative asset, and ad set targeting configurations automatically. If a direct connection is not possible, uploading a standard Meta Ads export (campaign and ad-level CSV) works and the analysis runs from those files instead.
For live data, the Meta Ads integration pulls campaign performance, ad-level frequency and CTR, placement-by-placement breakdowns, and ad set targeting details directly. There is no manual export step, and the data reflects the state of the account at the time the Flow runs. This is the recommended setup for teams running monthly audits across multiple client accounts.
For uploaded exports, the standard Meta Ads campaign-and-ad export in CSV format works. Download from Ads Manager, upload to Juma in the chat or attach to the project, and run the same prompt. The only difference is that the data reflects whatever date range the export covers.
How is this different from Meta's built-in Ads Manager reporting?
Ads Manager shows what happened campaign by campaign. This Flow puts spend share and conversion share next to each other across the full account, flags creative fatigue at the ad level, breaks down spend by placement in one view, and builds a prioritised action plan. Those four things together are what Ads Manager does not produce on its own.
Ads Manager surfaces performance metrics one campaign at a time but does not compare budget allocation across the full account in a single view. Seeing that a Conversions campaign spent $4,000 and an Advantage+ shopping campaign spent $800 tells you little on its own. Seeing that the Conversions campaign produced 12 purchases at $333 cost per purchase while Advantage+ produced 18 purchases at $44 changes the conversation entirely.
The Flow also surfaces creative fatigue and placement imbalances in a single artifact the team can hand to the client. Strategy, taste, and judgment stay human. Juma surfaces the patterns; the team decides which moves to make.